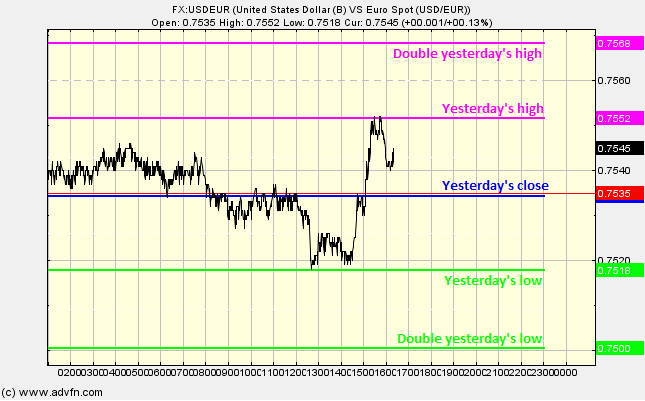
The Pivot Points chart study simply shows some key price levels from the previous day. The previous days closing price level is the middle line, represented in blue. The inner pink and green lines are at the previous days high and low price level respectively, and finally the outer pink and green lines are simply double the high and low price levels from the previous day, respectively.
- Please note, this chart study only works for the FOREX, and on a 1 day graph. -
No parameters.
Pivot Points

Here is an example of the Pivot Points chart study (on a FOREX graph)
Trading above (or below) the pivot points is thought to show a bullish (or a bearish) attitude.

It looks like you are not logged in. Click the button below to log in and keep track of your recent history.
Support: +44 (0) 203 8794 460 | support@advfn.com
By accessing the services available at ADVFN you are agreeing to be bound by ADVFN's Terms & Conditions