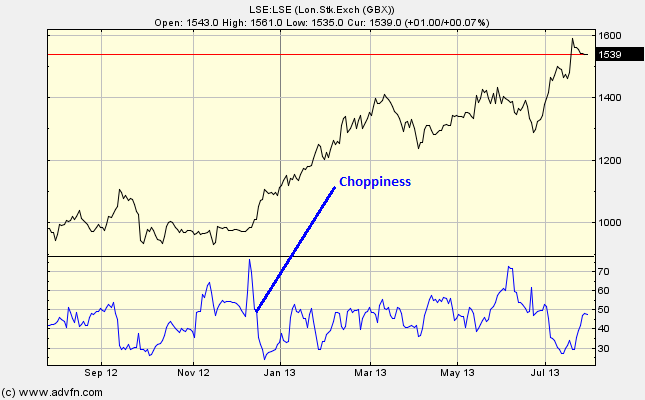
The Choppiness chart study does what it says on the tin, it measures how choppy the price level is. We can read the Choppiness indicator at the bottom of the chart where it has a scale from 0 to 100. There is an inverse relationship between the Choppiness and the price level.
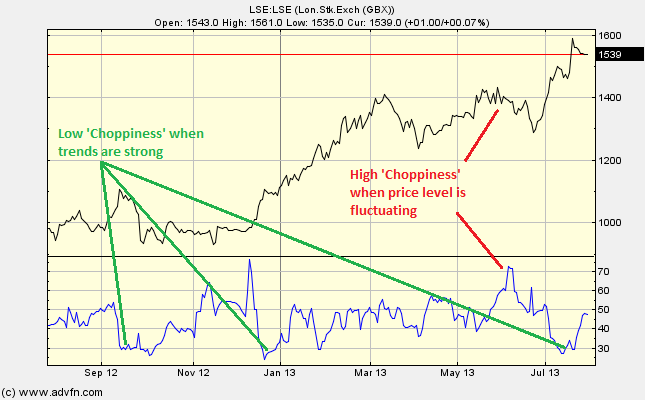
When the price level is experiencing a stong trend (either up or down) the choppiness is low. Similarly when the price level is fluctuating, without a predominant trend, then the Choppiness is higher. A 'Choppy Market' is where prices swing up and down with no real overall direction.
Parameters: Period.
For additional help on what the different parameters mean, that isn't included on this page, click here.
Choppiness

Here is an example of the Choppiness chart study (on a London Stock Exchange graph)
The basic idea is that when the market is heavily trending during the selected period, the Fractal Dimension chart study is close to one, and the Choppiness is around zero. Conversely, when the Choppiness is high, the market is in 'choppy consolidation'.
Reading the study:

Here is an example of the Choppiness and the price line (of the London Stock Exchange), and what it may indicate

It looks like you are not logged in. Click the button below to log in and keep track of your recent history.
Support: +44 (0) 203 8794 460 | support@advfn.com
By accessing the services available at ADVFN you are agreeing to be bound by ADVFN's Terms & Conditions