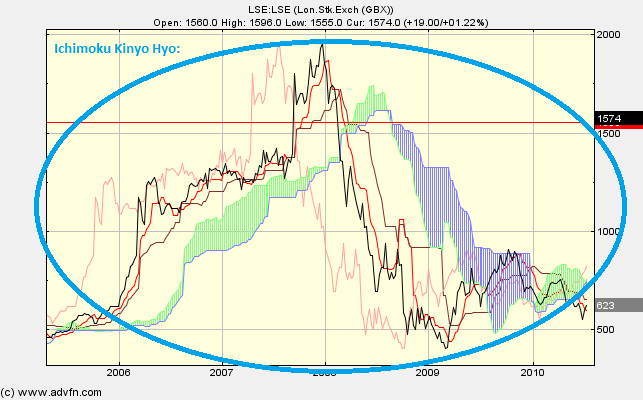
You're probably thinking the same thing that I thought when I first saw this chart study, but don't worry, it's not as bad as it looks.
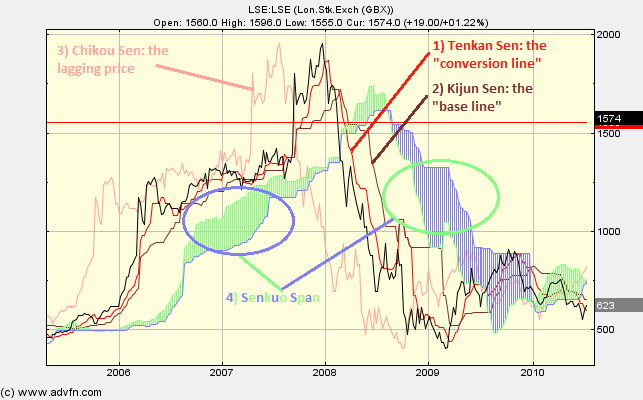
The Ichimoku Kinyo Hyo (Ichimoku' for short) chart study is made up of 4 separate indicators, which are all displayed at once. These four indicators are called:
The purpose of having 4 separate indicators all rolled into one is so that a trader can see what an asset/stock's price level has done, where it might go and also possible entry and exit points, without needing to cross-check it with 3 other indicators (although this is always advised!).
Parameters: Period 1 & 2.
For additional help on what the different parameters mean, that isn't included on this page, click here.
Ichimoku Kinyo Hyo

Here is an example of the Ichimoku Kinyo Hyo chart study (on a London Stock Exchange graph)
The Ichimoku consists of many different indicators which work with one another, these are very similar to Moving Averages (although not identical) and are based on high and low prices. These indicators are:
The area between these not only defines the trend (green during an uptrend, and blue during a downtrend), but acts as support and resistance for prices. This leads the current time by 26 periods. (Green/blue shaded area).
The 4 indicators:

Here is an example of the 4 Ichimoku Kinyo Hyo indicators (on a London Stock Exchange graph)
There are many indications Ichimoku helps with.
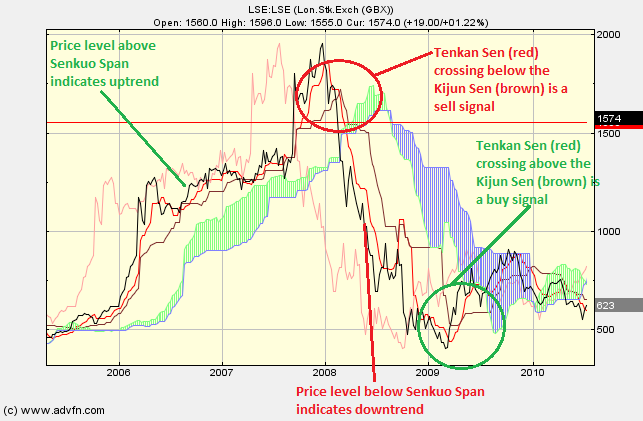
In general, when the price level is above the Senkuo Span (green/blue shaded area), there is an uptrend, and when the price is below the Senkuo Span, there is a downtrend. Tenkan Sen (red) crossing above the Kijun Sen (brown) is a buy signal, and below is a sell signal.
The positions of Tenkan Sen (red) and Kijun Sen (brown) with respect to the span is also important - if the price 26 periods ago is below the Chikou Span and a sell signal occurs, it is a stronger signal than if it had been above the close of 26 periods ago, and again vice versa.
Reading the study:

Here is an example of the Ichimoku Kinyo Hyo and the price line (of the London Stock Exchange), and what it may indicate
Ichimoku uses three key time periods for its input parameters: 9, 26, and 52. When Ichimoku was created back in the 1930s, a trading week was 6 days long. These parameters, thus, represent one and a half week, one month, and two months, respectively. Now that the trading week is 5 days, one may want to modify the parameters to 7, 22, and 44. You can do this by editing the study parameters to 7 and 22 - the third parameter is always double the second (ie 52 when it is 26, or 44 when it is 22).

It looks like you are not logged in. Click the button below to log in and keep track of your recent history.
Support: +44 (0) 203 8794 460 | support@advfn.com
By accessing the services available at ADVFN you are agreeing to be bound by ADVFN's Terms & Conditions