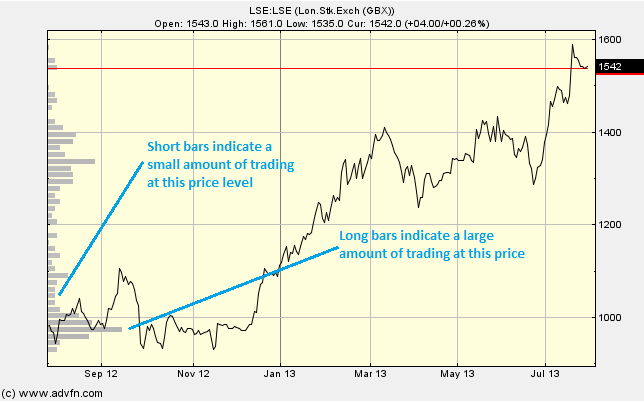
The Histogram chart study is shown on the left hand side of the graph. It plots the volume traded at each price within the range visible on the graph.
Histograms are often used to find prices of support or resistance. At
such level the volume can become higher, as the buyers and sellers are fighting
particular hard overs these areas.
No parameters.
Histogram

Here is an example of the Histogram chart study (on a London Stock Exchange graph)
See graph below.
Reading the study:

Here is an example of a Histogram and the price line (of the London Stock Exchange), and what it may indicate

It looks like you are not logged in. Click the button below to log in and keep track of your recent history.
Support: +44 (0) 203 8794 460 | support@advfn.com
By accessing the services available at ADVFN you are agreeing to be bound by ADVFN's Terms & Conditions