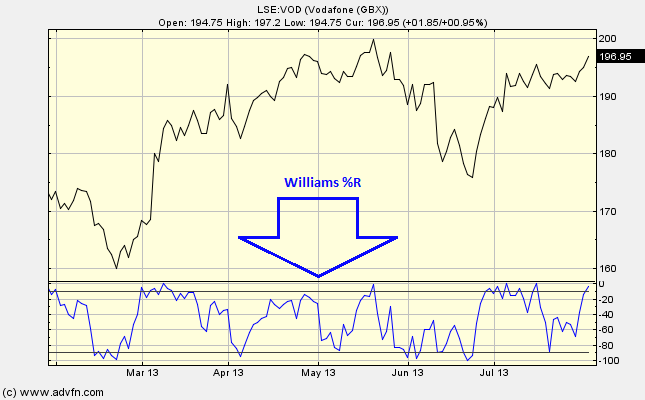
The Williams %R chart study is displayed at the bottom of the graph and has a scale from -100 to 0. Very similar to the fast Stochastic line. It is calculated by looking at the difference between the stock's closing price to the high/low range over the selected period (the period can be changed under "edit"). The inversion is corrected by multiplying by -100.
Parameters: Period & Offset.
For additional help on what the different parameters mean, that isn't included on this page, click here.
Williams %R

Here is an example of the Williams %R chart study (on a Vodafone graph)
A useful indicator, which can signal good times to buy and sell, although it is always advised to use another chart study to confirm any trend reversals.
These signals come about when the Williams %R value changes. When this value is between 0 and -20, this is thought to be an overbought signal (good time to sell), and when the value is between -100 and -80, this is thought to be an oversold signal (good time to buy).
Sometimes there can be a movement of the Williams %R out of the above boundaries when there is not actually a reversal in trend, so it can sometimes be useful to wait for the Williams %R to cross the -50 line before making a trading decision. As well as cross checking the study with another.
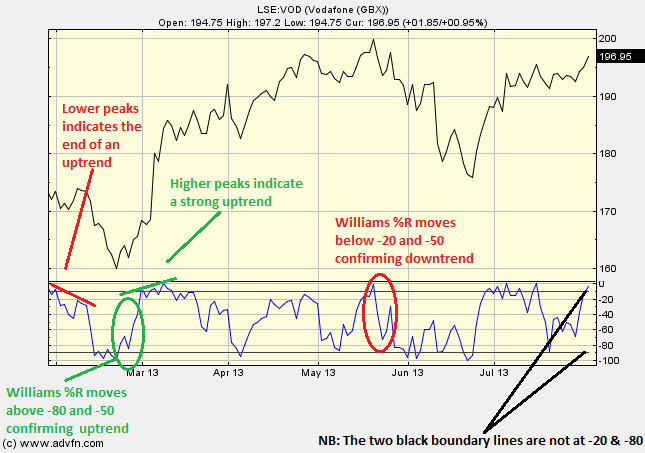
Furthermore, subsequential peaks above the -20 line, or subsequential troughs below the -80 can also be an indicator. If there are subsequential peaks above the -20 line which are getting higher (lower) then this is a sign that the uptrend is strong (weakening). Conversely, if there are subsequential troughs below the -80 line which are getting lower (higher) then this is a sign that the downtrend is strong (weakening).
Reading the study:

Here is an example of the Williams %R and the price line (for Vodafone), and what it may indicate

It looks like you are not logged in. Click the button below to log in and keep track of your recent history.
Support: +44 (0) 203 8794 460 | support@advfn.com
By accessing the services available at ADVFN you are agreeing to be bound by ADVFN's Terms & Conditions