We could not find any results for:
Make sure your spelling is correct or try broadening your search.
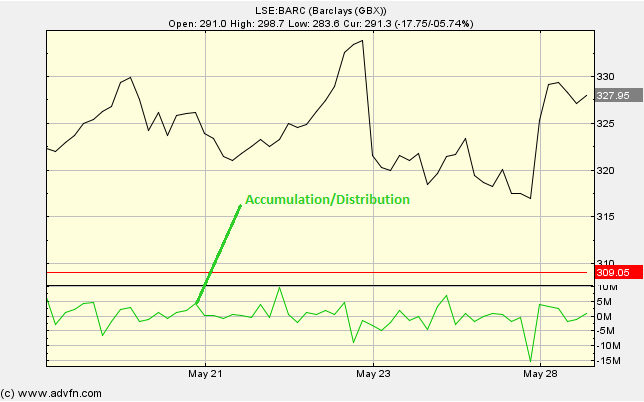
The Accumulation/Distribution chart study is used to look at momentum of volume flow. Think of accumulating as buying and distributing as selling. The way in which this study is calculated, is by looking at the divergence between the price level and volume flow. We see accumulation when a period's close is higher than the period before, the volume is then added on. Conversely, we see distibution when a period's close is lower than the period before, the volume is then subtracted.
No Parameters.
Accumulation/Distribution

Here is an example of the Accumulation/Distribution chart study (on a London Stock Exchange graph)
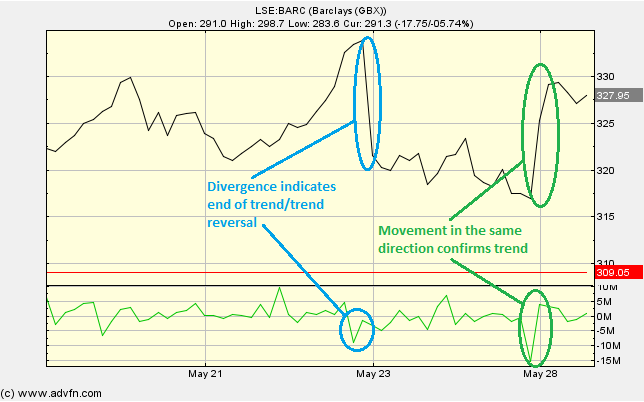
Looking for divergence between the price level and the Accumulation/Distribution line is key, much like other Momentum Studies. If divergence has been noted then confirm using another technical indicator. Conversely, if the Accumulation/Distribution and the price level are not diverging then this can be used to confirm a trend. During a downtrend, if we see many 'up days' ocurring with high volume then this could signal a possible reversal in trend. Vice versa during an uptrend.
Bottom line: increasing and decreasing prices are confirmed by increasing volume. While increasing and decreasing prices and not confirmed when volume is decreasing, and this might be a signal of a trend reversal.
Reading the study:

Here is an example of the Accumulation/Distribution and the price line (of the London Stock Exchange), and what it may indicate

It looks like you are not logged in. Click the button below to log in and keep track of your recent history.
Support: +44 (0) 203 8794 460 | support@advfn.com
By accessing the services available at ADVFN you are agreeing to be bound by ADVFN's Terms & Conditions