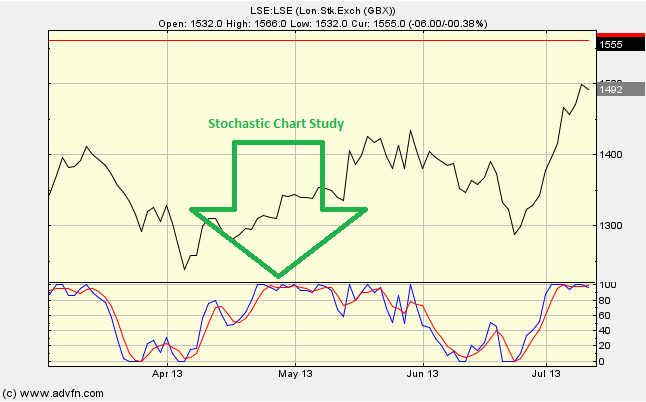
Here we have two lines, red and blue, displayed in the bottom of the graph, with a range 0 to 100. Signals can be given both when the lines cross, and when the lines get closer to 100 or 0.
Fast line: Blue
Slow line: Red
How is the Stochastic constructed?
Firstly, the trading range is the highest high minus the lowest low of the selected period. The fast line is formed by comparing the last closing price to the recent trading range. The slow line is then formed by smoothing the fast line with a Moving Average.
We can also choose slow Stochastics. Here we plot the smoothed slower line (as mentioned above) as the fast line, and then we take a Moving Average of this as our slow line.
Parameters: K period, D period, fast & K MA period.
For additional help on what the different parameters mean, that isn't included on this page, click here.
Stochastic

Here is an example of the Stochastic chart study (on a London Stock Exchange graph)
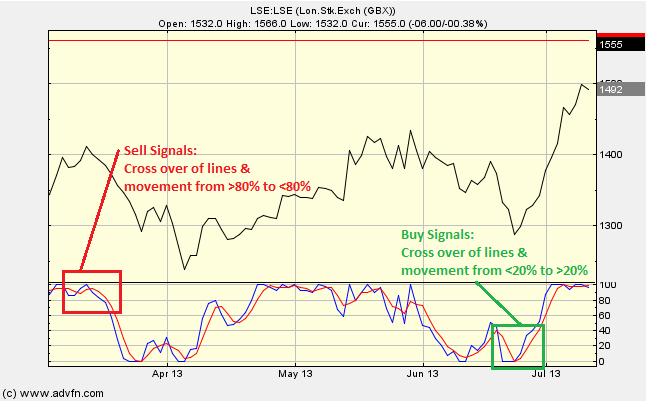
Buy Signals:
When the Stochastics are below 20% (indicates oversold).
When the Stochastics reach a higher [in magnitude] low than the previous low.
When the Stochastics move back above 20%.
When the fast line crosses above the slow line.
Sell Signals:
When the Stochastics are above 80% (indicates overbought).
When the Stochastics reach a high high than the previous high.
When the Stochastics move back below 80%.
When the slow line crosses below the fast line.
Reading the Study:

Here is an example of the Stochastisc and the price line (of the London Stock Exchange), and what it may indicate

It looks like you are not logged in. Click the button below to log in and keep track of your recent history.
Support: +44 (0) 203 8794 460 | support@advfn.com
By accessing the services available at ADVFN you are agreeing to be bound by ADVFN's Terms & Conditions