We could not find any results for:
Make sure your spelling is correct or try broadening your search.
The Volume Weighted Average Price chart study is obviously dependant on the volume traded of a particular stock, to that end, this study will only show data for a price level which has volume behind it. This chart study is also calculated from the moment you select it, and can only be used on a one day/intraday graph.
This study is similar to a Moving Average, however volume [traded] is used to 'weight' the average price, for the selected one day period. This study is shown as an overlay onto the price level and can either be shown as a line, or as candles. The candles are hollow when the price is rising and filled in when the price is falling, with the wicks showing high and low values.
As this value is generated on our servers before being transmitted, it has a few limitations. Firstly, its period cannot be changed from 15 minutes. It also is limited to working on LSE stocks whose price is generated by AT Trades, namely SETS stocks. It also cannot operate historically, ie the study will start working the moment it is selected and onwards, but will not show values from the past. The Volume Weighted Moving Average avoids each of these problems, so may be of more use on other exchanges and for historical values, but it operates on a minute by minute case, rather than trade by trade.
Parameters: Lines or candles.
VWAP

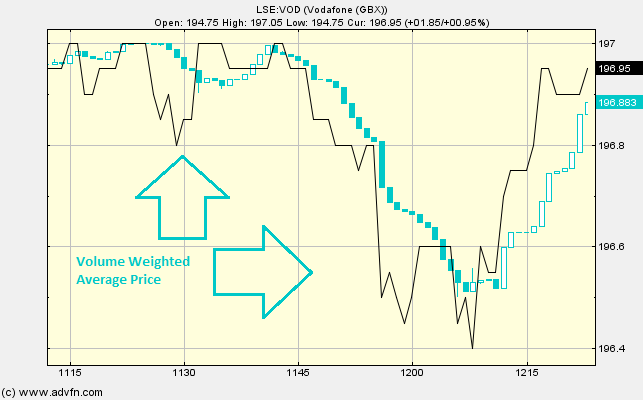
Here is an example of the VWAP chart study (on a Vodafone graph)
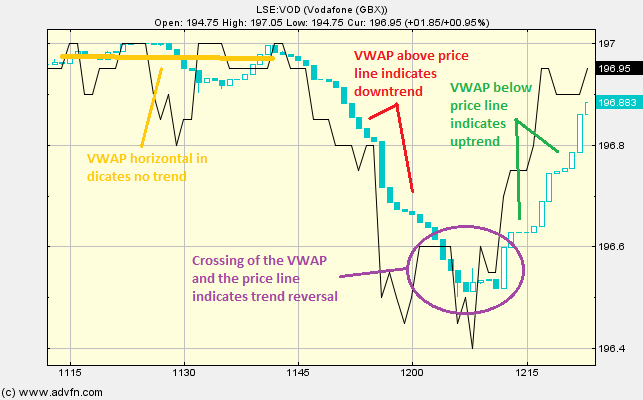
You can compare the VWAP with the price level to determine the general trend for intraday prices. Similarly to a Moving Average, if the VWAP is above the price line then this usually indicates a downtrend, conversely, if the VWAP is below the price line then this usually indicates an uptrend. Thus any crossing of the VWAP and the price line can indicate a trend reversal. If the price is not really experiencing a trend, then the VWAP will be moving more-or-less horizontally (i.e. flat) through the price line.
We will also see that the VWAP falls inbetween the day's high and low.
Reading the study:

Here is an example of a VWAP and the price line (for Vodafone), and what it may indicate

It looks like you are not logged in. Click the button below to log in and keep track of your recent history.
Support: +44 (0) 203 8794 460 | support@advfn.com
By accessing the services available at ADVFN you are agreeing to be bound by ADVFN's Terms & Conditions