We could not find any results for:
Make sure your spelling is correct or try broadening your search.
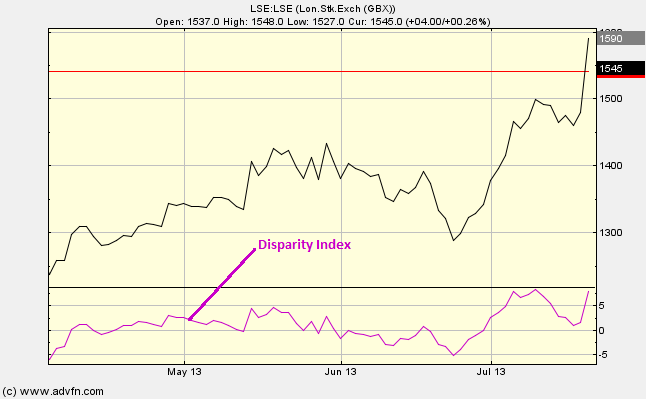
The Disparity Index measures the percentage variation of the price level from a Moving Average of the data. You can choose which Moving Average is used under 'edit, whether this be a Simple Moving Average, an Exponential Moving Average or an Adaptive Moving Average.
Parameters: Period & selection between: Simple Moving Average (SMA), Exponential Moving Average (EMA) or Adaptive Moving Average (AMA).
For additional help on what the different parameters mean, that isn't included on this page, click here.
Disparity Index

Here is an example of the Disparity Index chart study (on a London Stock Exchange graph)
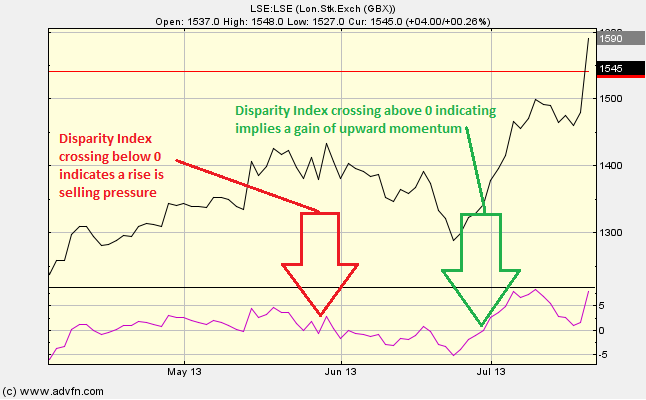
Similar to the Rate of Change chart study. When the Disparity Index is above 0 (or crosses above it from below), this suggests that the price level is gaining upward Momentum. While a Disparity Index below 0, can be an indication that selling pressure is rising.
Reading the study:

Here is an example the Disparity Index and the price line (of the London Stock Exchange), and what it may indicate

It looks like you are not logged in. Click the button below to log in and keep track of your recent history.
Support: +44 (0) 203 8794 460 | support@advfn.com
By accessing the services available at ADVFN you are agreeing to be bound by ADVFN's Terms & Conditions