The Ultimate Oscillator chart study is displayed at the bottom of the chart and has a range from 0 to 100. This study uses multiple time periods, three to be precise, which is how it differs from the Price Oscillator which uses two, and the Disparity Index which uses only one. These three time periods are slow, medium and fast, but can be thought of as short-term, medium-term and long-term (the periods of which can be changed under "edit") traders using use periods: 28, 14 & 7 respectively.
We use this chart study to indicate overbought/sold conditions, buy/sell signals and also to confirm price trend/reversals.
The advantage of incorporating longer time periods into the formula is to try and combat a common problem that other Momentum Oscillators/Chart Studies can experience, many momentum oscillators can surge at the beginning of a [prominent] uptrend, but then signal a downtrend even as the advance continues. At the same time, we must still include short-term time periods to indicate price action early.
Parameters: Period for fast, medium and slow.
For additional help on what the different parameters mean, that isn't included on this page, click here.
Ultimate Oscillator

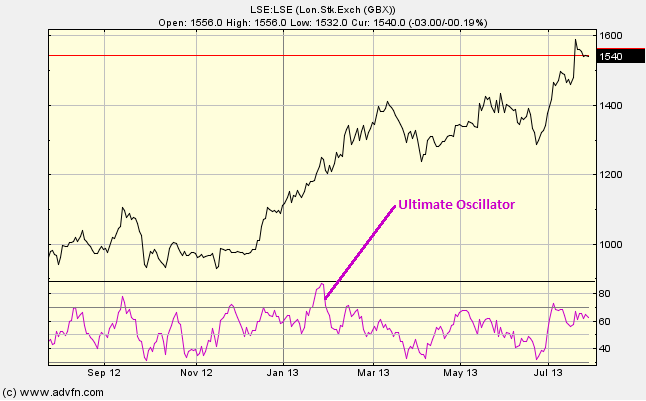
Here is an example of the Ultimate Oscillator chart study (on a London Stock Exchange graph)
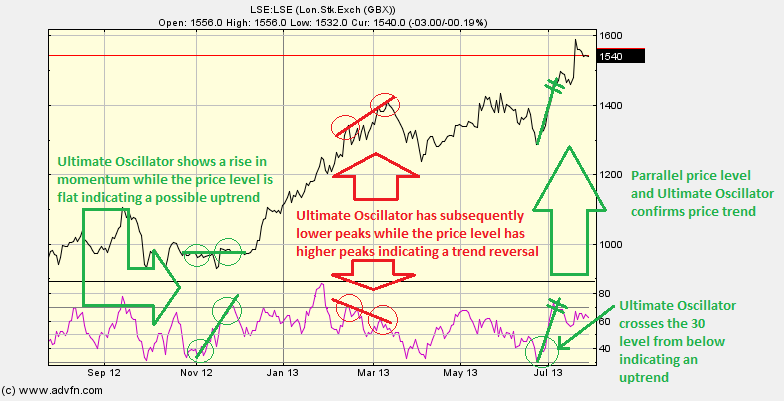
Similar to the Relative Strength Index, when the Ultimate Oscillator goes above the 70 level, this is an overbought signal (i.e. time to sell), and conversely when the Ultimate Oscillator goes below the 30 level, this is an oversold signal (i.e. time to buy).
Divergence between the Ultimate Oscillator and the price level can also be used as an indicator. If the Ultimate Oscillator is either flat or moving down, while the price is experiencing an uptrend, then this can sometimes be an indication that a peak [of the price level] is near and the trend is nearing the end. Similarly, if the Ultimate Oscillator is either flat or moving up, while the price is experiencing a downtrend, then this can sometimes be an indication that a trough [of the price level] is near and the trend is nearing the end.
Reading the study:

Here is an example of the Ultimate Oscillator and the price line (of the London Stock Exchange), and what it may indicate

It looks like you are not logged in. Click the button below to log in and keep track of your recent history.
Support: +44 (0) 203 8794 460 | support@advfn.com
By accessing the services available at ADVFN you are agreeing to be bound by ADVFN's Terms & Conditions