This chart study indicates how fast the stock is moving upwards or downwards i.e. the acceleration of a security's price. It does this by looking at the difference between the price now and the price a set number of periods ago (the period can be changed under "edit").
Parameters: Period.
For additional help on what the different parameters mean, that isn't included on this page, click here.
Momentum

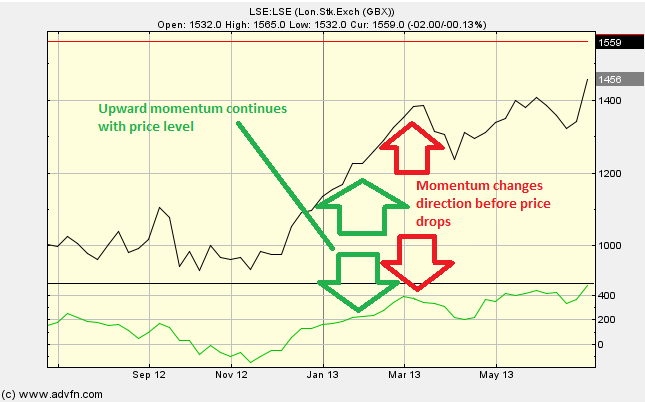
Here is an example of the Momentum chart study (on a London Stock Exchange graph)
The idea is if a security has a high momentum, then the price level is more likely to continue in the same direction, whether this be up or down, than to change direction. Conversely, if the momentum slows, then this could be an indication that the trend is coming to an end, and there may be a change in direction.
Momentum

Here is an example of the Momentum of the price line, with the price line (of the London Stock Exchange), and what it may indicate

It looks like you are not logged in. Click the button below to log in and keep track of your recent history.
Support: +44 (0) 203 8794 460 | support@advfn.com
By accessing the services available at ADVFN you are agreeing to be bound by ADVFN's Terms & Conditions