We could not find any results for:
Make sure your spelling is correct or try broadening your search.
The Chaikin Oscillator chart study measures the Momentum of the Accumulation/Distribution, using the Moving Average Convergence Divergence (MACD) formula. It is calculated by subtracting a slow Moving Average of the Accumulation/Distribution, from a faster Moving Average of the Accumulation/Distribution (the period for both the fast and slow moving average can be changed under "edit"). The period(s) are commonly set to 3 and 10.
Parameters: Fast & slow period, and use Exponential Moving Average.
For additional help on what the different parameters mean, that isn't included on this page, click here.
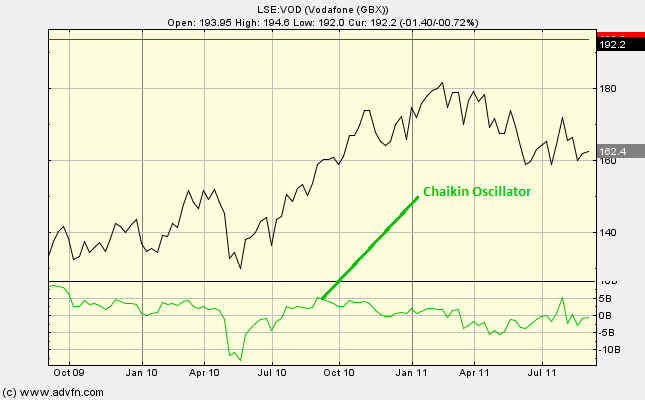
Chaikin Oscillator

Here is an example of the Chaikin Oscillator chart study (on a Vodafone graph)
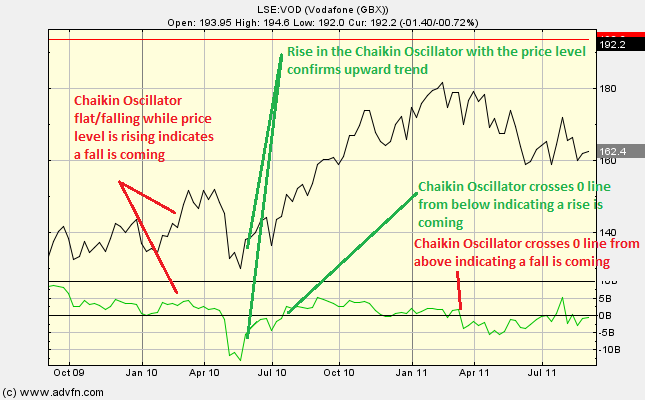
Used to anticipate direction change. We look for when the Chaikin Oscillator crosses the 0 line and/or divergence of the Chaikin Oscillator from the price level.
Chaikin Oscillator crossing the 0 line: Crossing from below can signal a buy, while crossing from above can signal a sell.
Divergence: A buy signal can be indicated when the price level is decreasing while the Chaikin Oscillator starts to increase. This is because this can sometimes be an indicator that an uptrend is on its way. Conversely, a sell signal can be indicated when the price level is increasing while the Chaikin Oscillator starts to decrease. This is because this can sometimes be an indicator that a downtrend is on its way.
Commonly used along side a Band/Channel chart study.
Reading the study:

Here is an example of teh Chaikin Oscillator and the price line (for Vodafone), and what it may indicate

It looks like you are not logged in. Click the button below to log in and keep track of your recent history.
Support: +44 (0) 203 8794 460 | support@advfn.com
By accessing the services available at ADVFN you are agreeing to be bound by ADVFN's Terms & Conditions