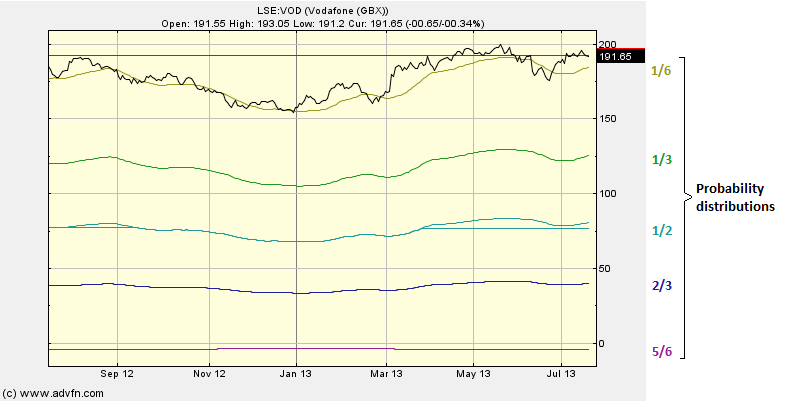
Just as Bollinger Bands plot the Standard Deviation of the price either side of the Simple Moving Average (period adjustable under 'edit'), SkewBands attempts to plot both the Standard Deviation and Skew around the Simple Moving Average.
Firstly the chart finds the Simple Moving Average of the prices for the selected period, this is then used to find the standard deviation and skew of the prices over that period, and then it fits a smooth probability distribution using these values. The contours are plotted at the points where the probability distribution reaches 5/6 (purple), 2/3 (blue), 1/2 (cyan), 1/3 (green) or 1/6 (yellow/brown), of its peak value. Note this is when the parameter 'Percentile' is set to 6, which is the default.
SkewBands thus predict that price will be inside the purple bands 1/6 of the time, between the blue bands 1/3 of the time, between the cyan bands 1/2 of the time, the green bands 2/3 of the time and the yellows bands 5/6s of the time. Since the skew has a definite direction, the bands are not symmetrical and thus point out peaks in a particular direction.
Parameters: Period, Percentile and 'Central Morr'.
For additional help on what the different parameters mean, that isn't included on this page, click here.
Skewbands

Here is an example of the Skewbands chart study (on a Vodafone price level graph)
Using the edit button, you can change the number of percentiles plotted, you can change the period, and finally you can change weather or not the mean, skew and Standard Deviation are calculated using the final point of the bars, or the central point.
Using the final point, Skewbands look similar to Bollinger Bands.
Using the central point, Skewbands will follow the stocks movements closer.

It looks like you are not logged in. Click the button below to log in and keep track of your recent history.
Support: +44 (0) 203 8794 460 | support@advfn.com
By accessing the services available at ADVFN you are agreeing to be bound by ADVFN's Terms & Conditions