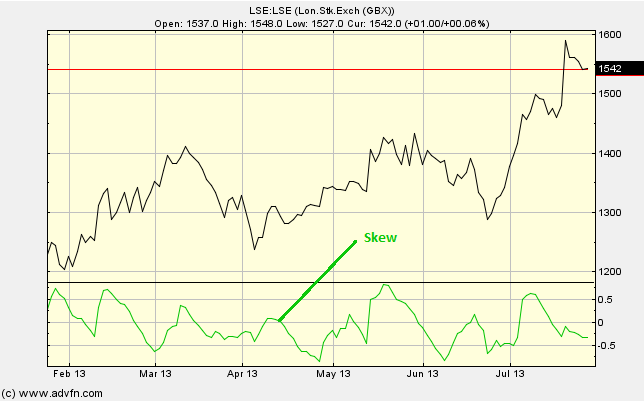
The Skew chart study, is the measure of distibution.
The Skew is the sum of the distances between each point and the mean, all cubed, divided by the number of points and then divided by the Standard Deviation cubed. If you were to draw a graph of the deviation of all the points from their mean value, then the skew would measure how tilted this relationship was. The period over which the skew is measured can be changed under 'edit'. Selecting "Forward"??
Parameters: Period & Forward Skew.
For additional help on what the different parameters mean, that isn't included on this page, click here.
Skew

Here is an example of the Skew chart study (on a London Stock Exchange graph)
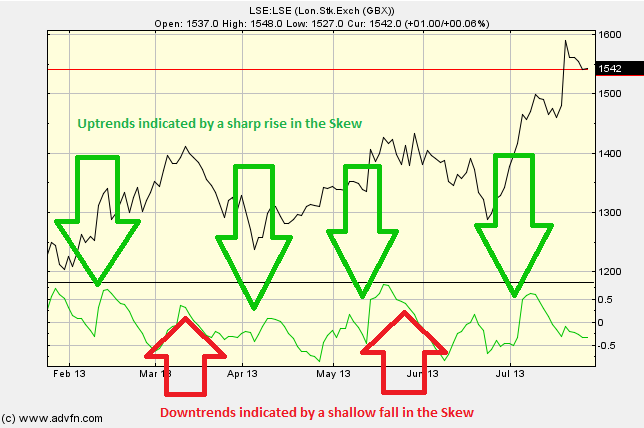
The Skew will pick out regions trending upwards (shown with a steep positive gradient) and downwards (shown with a shallow negative gradient).
Reading the study:

Here is an example of the Skew and the price line (of the London Stock Exchange), and what it may indicate

It looks like you are not logged in. Click the button below to log in and keep track of your recent history.
Support: +44 (0) 203 8794 460 | support@advfn.com
By accessing the services available at ADVFN you are agreeing to be bound by ADVFN's Terms & Conditions