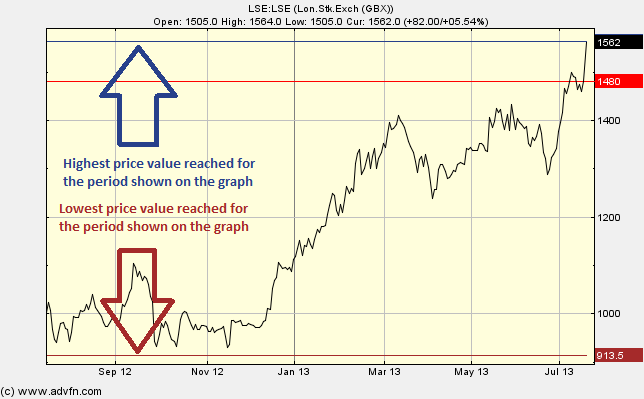
The High and Low chart study simply indicates the highest and lowest price values reached for the period shown on the graph at that time. The highest price is indicated by the blue line and value, and the lowest price is indicated by the brown line and value.
No parameters.
High and Low

Here is an example of the High and Low chart study (on a London Stock Exchange graph)

It looks like you are not logged in. Click the button below to log in and keep track of your recent history.
Support: +44 (0) 203 8794 460 | support@advfn.com
By accessing the services available at ADVFN you are agreeing to be bound by ADVFN's Terms & Conditions