Bollinger Bands are a volatility indicator, similar to Keltner Bands. There is a Simple Moving Average (period adjustable under 'edit'), which runs inbetween the two bands which are plotted at 'x' standard deviations either side. You can change the standard deviation of the Bollinger bands under 'edit'. (Usually set to approx 2).
Parameters: Period & Deviation.
For additional help on what the different parameters mean, that isn't included on this page, click here.
Bollinger Bands

Here is an example of the Bollinger Bands chart study (on a London Stock Exchange graph)
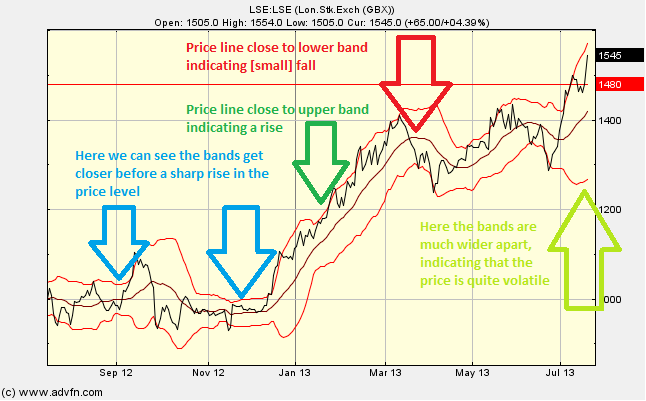
Optimal period is approximately 20-21 days, a period of less than 10 days does not work as well days. When the Bollinger bands are close this tends to indicate that the market is not very volatile and vice versa. When the bands contract together, this can sometimes be an indication that the volatility is about to increase (or decrease) sharply. The bands can draw close as the market is consolidating, then swing wildly away from each other, thus the distance between the two outer bands becomes greater.
When the price line is close to the upper band, this can indicate that there is a prominant uptrend, and vice versa.
When using Bollinger Bands (with a standard deviation set to 2), 95% of price movement occurs within the bands. The upper and lower bands are considered as extremes of the price movement, and can be used as a warning that price exhaustion may be occurring. Buy signals occur when the price is below the lower band and sell signal occur when price exceeds the upper band.
Reading the study: Bollinger Bands

Here is an example of a the Bollinger Bands with the price line (of the London Stock Exchange), and what it may indicate

It looks like you are not logged in. Click the button below to log in and keep track of your recent history.
Support: +44 (0) 203 8794 460 | support@advfn.com
By accessing the services available at ADVFN you are agreeing to be bound by ADVFN's Terms & Conditions