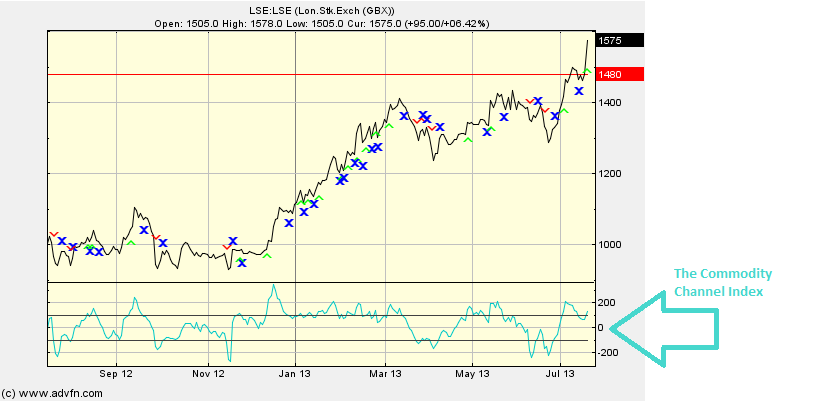
The Commodity Channel Index (CCI) is the purple line graph in the bottom of the chart.
The purpose of the CCI is to measure the variation of the price from its statistical mean. This in turn can indicate a new trend and/or warn of 'extreme' conditions. When the CCI crosses the horizontal 0 axis, there is zero variation from the mean, whereas when the CCI crosses over the +/- 100 axis, the variation is considered to be quite large.
Parameters: Period, Modified CCI & Signals.
For additional help on what the different parameters mean, that isn't included on this page, click here.
The Commodity Channel Index

Here is an example of the The Commodity Channel Index chart study (on a London Stock Exchange graph)
The CCI is calculated by first finding 3 different variables, and then plugging these into a formula. Firstly, the Typical Price (TP) for the period, which is one third of the sum of the highest price, plus one third of the sum of the lowest price, plus one third of the close price for the period. Then we need the average Mean Deviation of the Typical Prices (MDTP), and the [Simple] Moving Average of the Typical Prices (MATP), which are both calculated for the selected period (the period can be changed under "edit").
Once we have these three values the CCI can then be calculated.
We use the formula:
CCI = (TP - MATP) / (0.15 x MDTP)
[N.B. the index is only scaled by the inverse factor of 0.15 so that a 'nice' number is attained. This figure can then easily be related to the +/- 100 boundaires.]
Clicking 'edit' will allow you to select "modified CCI", in which the TP is calculated as one third of the sum of the close for the current period, plus one third of the highest price, plus one third of the lowest price for the selected period.
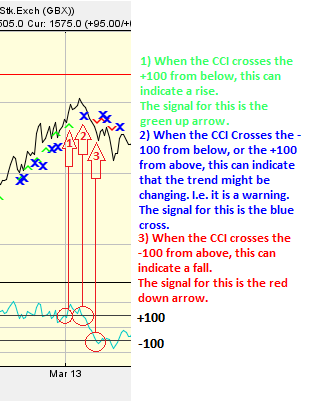
 Here is an example of a the CCI with the price line (of the London Stock Exchange), and what it may indicate
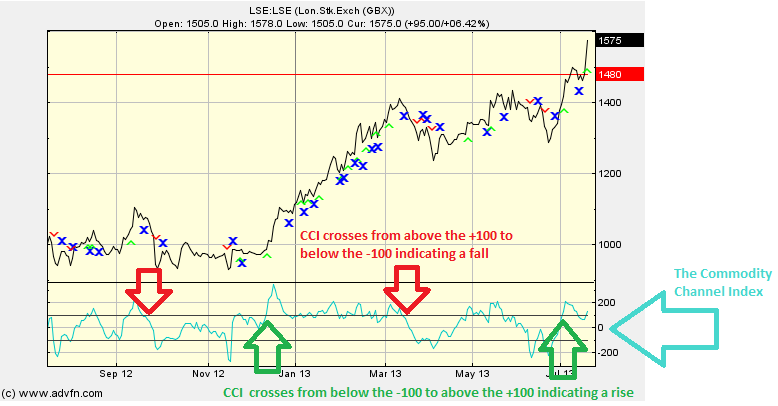
CCI can signal a good time to buy when it crosses from below -100, to above -100. Similarly the CCI can indicate a good time to sell, when it crosses from above 100, to below 100.
For scaling purposes, the constant 0.15 results in 70-80% of the CCI values are between −100 and +100. This percentage of CCI values that fall between +100 and −100 will adjust as the selected period is changed. A shorter period, will result in the CCI being more volatile, and a smaller percentage of the CCI values will be between +100 and −100. ive versa for a longer period.
The CCI tends to be relatively high (i.e. over +100) when prices are far above their average, this can indicate over buying in the market. The CCI tends to be relatively low (i.e. under -100) when prices are far below their average, this can indicate over selling in the market. The green and red arrows are indicators of when the CCI crosses the +100 from below, and the -100 from above respectively. The blue crosses indicate the CCI crossing the +/-100 back in towards the middle 0 axis. These are the 'signals' and can be turned on and off under 'edit'.
Reading the study: CCI

Here is an example of a the CCI with the price line (of the London Stock Exchange), and what it may indicate

It looks like you are not logged in. Click the button below to log in and keep track of your recent history.
Support: +44 (0) 203 8794 460 | support@advfn.com
By accessing the services available at ADVFN you are agreeing to be bound by ADVFN's Terms & Conditions