We could not find any results for:
Make sure your spelling is correct or try broadening your search.
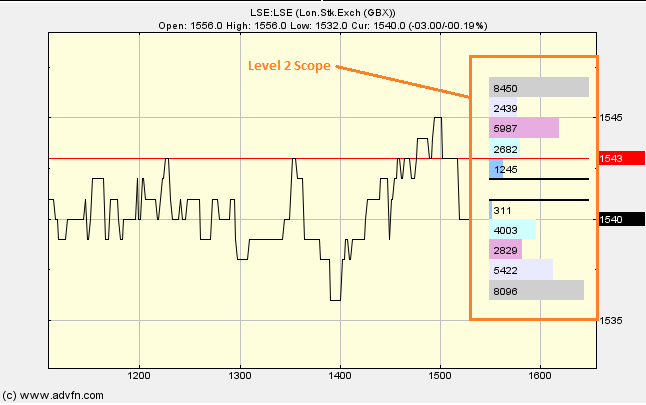
The Level 2 Scope chart study provides a real-time visual representation of the full Level 2 order book as a histogram, overlayed on top of the chart. This updates whenever there is a change in the Level 2 price information. The colouring and prices displayed are the same as the "Summary" mode on the Level 2 order book.
Parameters: Positions & Width.
For additional help on what the different parameters mean, that isn't included on this page, click here.
Level 2 Scope

Here is an example of the Level 2 Scope chart study (on a London Stock Exchange graph)
The width of the bar(s) corresponds to the volume of stock available at that price level within the order book, and the price is the value at the edge of the bar nearest the current price, i.e. the lower edge of the offers (top values), and the upper edge of the bids (lower values). Obviously, the current spread (know as the Bid/Offer Spread) is equal to the spacing between the two bars closest to the current price level.
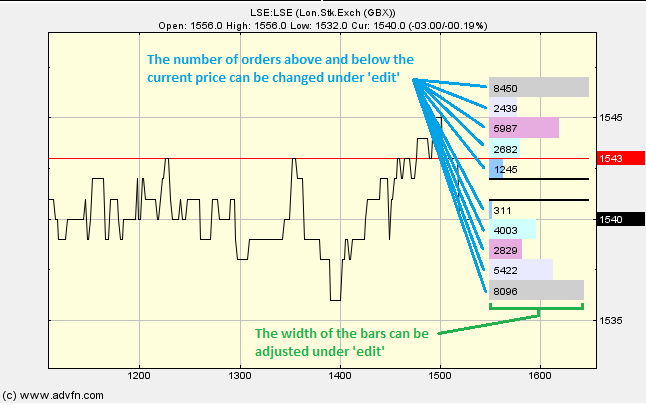
Although the width of the bars represents the volume at the different price levels, you can edit the maximum width of the bars, thus displaying the Level 2 Scope chart study on more, or less, of your graph (you can adjust this under 'edit'). You can also change the total number of "positions" displayed i.e. the number of orders either side of the crossover price (also changable under 'edit').
Reading the study:

Here is an example of the Level 2 Scope (on a London Stock Exchange graph), and what you can change
Any stock which you have Level 2 access to, can be viewed with the 'Level 2 Scope' chart study - if you do not have access to this information for a stock, or there is no Level 2 information for this stock, nothing will be displayed.
This study tracks the entire order book, and so uses more bandwidth than a regular chart. For watching a particularly active order book (eg, NASDAQ:GOOG) a broadband connection is recommended. It will also take a few seconds to display once selected, depending on your connection.
For Market Makers (MMs) stocks, the width of the bars displays the ratio of Market Makers offering to buy or sell at that particular point, so a wider bar indicates more MMs at that price.
You will normally have to adjust the period(s) selected, in order to view one day of data, otherwise you will not see the Level 2 Scope chart study.

It looks like you are not logged in. Click the button below to log in and keep track of your recent history.
Support: +44 (0) 203 8794 460 | support@advfn.com
By accessing the services available at ADVFN you are agreeing to be bound by ADVFN's Terms & Conditions