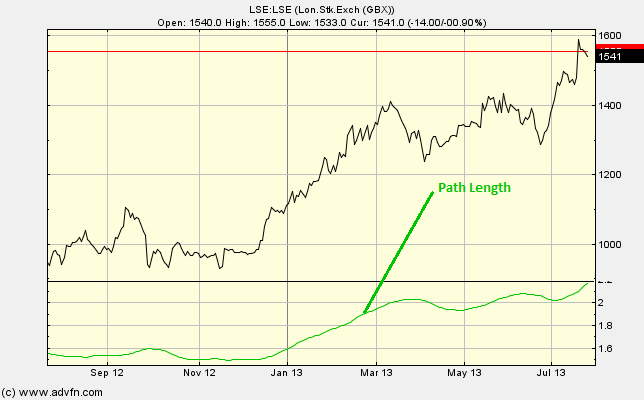
The Path Length shows how wiggly the price movement is at any time and is related to the Fractal Dimension of the prices movement.
How is it calculated?
The path length is calculated by adding the lengths of lines connecting various points together. This can be connecting either: the last periods close to the open, to the low, to the high and then to the close. Or, the last periods close, to the open, to the high, to the low and then to the close, which ever is highest. The vertical price step is scaled so that the average movement along the whole chart has a length of 1. This quantity is then divided by 4 so that one time period moving with the price movement, in a straight line, has a path length of 1.
Due to the variation in the path length being very rapid, we smooth it using a Simple Moving Average of a given period (the period can be changed under "edit").
Parameters: Period.
For additional help on what the different parameters mean, that isn't included on this page, click here.
Path Length

Here is an example of the Path Length chart study (on a London Stock Exchange graph)
A sudden jump in the path length signals a period of rapid changes in price, this could be an indication of a reversal in trend.

It looks like you are not logged in. Click the button below to log in and keep track of your recent history.
Support: +44 (0) 203 8794 460 | support@advfn.com
By accessing the services available at ADVFN you are agreeing to be bound by ADVFN's Terms & Conditions