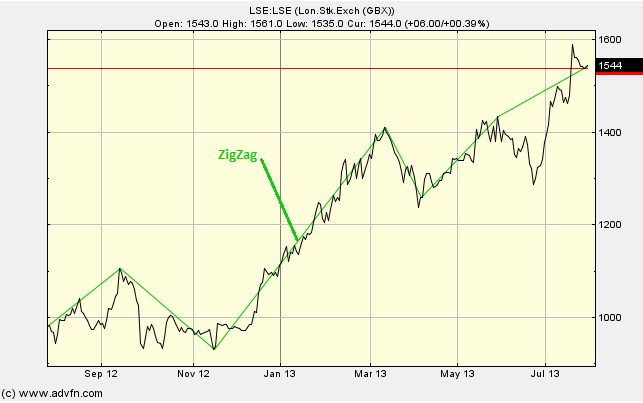
ZigZag is not an indicator in and of itself, but rather serves to filter out random noise and compare relative price movements. ZigZag can be set to acknowledge minimum price changes and ignore those that do not fit the criteria. The minimum price movements are set in percentage terms and can be based on either the close or high/low range.
Setting ZigZag to 10% gives a line that only reverses after a change from high to low of 10% or greater. For example: if a stock traded from a low of 100 to a high of 109, the ZigZag would not draw a line, because the move was less than 10%. If the stock advanced from a low of 100 to a high of 110, then the ZigZag would draw a line from 100 to 110. If the stock continued on to a high of 112, this line would be extended to 112 (100 to 112). This line continues until the stock declines 10% or more from its high - in this instance, it would have to decline 11.2 points to 100.8, to reverse and draw another line.
Parameters: Percentage.
For additional help on what the different parameters mean, that isn't included on this page, click here.
ZigZag

Here is an example of the ZigZag chart study (on a London Stock Exchange graph)
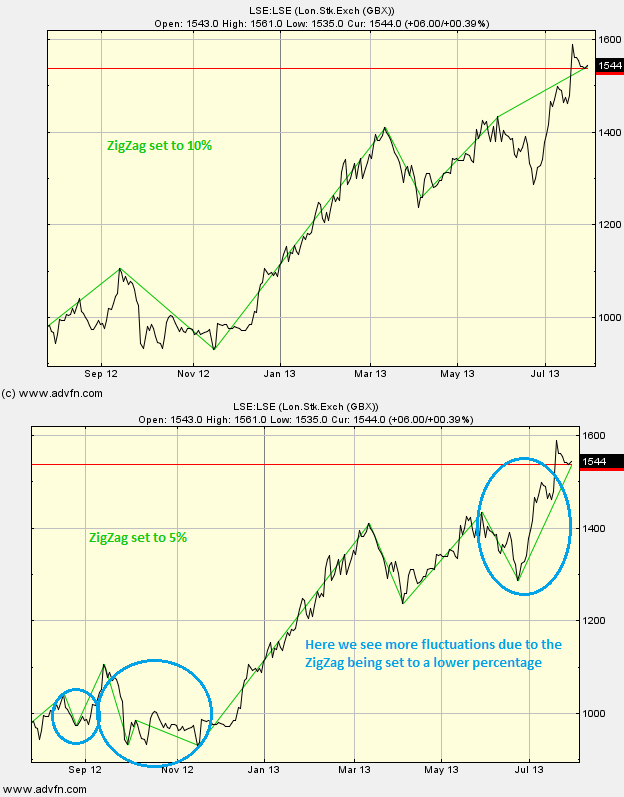
ZigZag is useful in filtering out volatility and daily price fluctuations. If price movements smaller than 5% are deemed insignificant, then the ZigZag can be set at 5% and all movements less than 5% will be ignored.
Reading the study:

Here is an example of the ZigZag and the price line (of the London Stock Exchange), and how the percentage parameter can differ

It looks like you are not logged in. Click the button below to log in and keep track of your recent history.
Support: +44 (0) 203 8794 460 | support@advfn.com
By accessing the services available at ADVFN you are agreeing to be bound by ADVFN's Terms & Conditions