| Share Name | Share Symbol | Market | Type |
|---|---|---|---|
| Tesla Inc | NASDAQ:TSLA | NASDAQ | Common Stock |
| Price Change | % Change | Share Price | Bid Price | Offer Price | High Price | Low Price | Open Price | Shares Traded | Last Trade | |
|---|---|---|---|---|---|---|---|---|---|---|
| -13.11 | -4.80% | 260.02 | 258.73 | 265.80 | 276.0767 | 260.6208 | 275.50 | 123,807,390 | 04:00:04 |
UNITED STATES
SECURITIES AND EXCHANGE COMMISSION
Washington, DC 20549
FORM 8-K
CURRENT REPORT
Pursuant to Section 13 or 15(d) of
The Securities Exchange Act of 1934
Date of Report (Date of earliest event reported)
November 3, 2015
Tesla Motors, Inc.
(Exact name of registrant as specified in its charter)
| Delaware | 001-34756 | 91-2197729 | ||
| (State or other jurisdiction of incorporation) |
(Commission File Number) |
(IRS Employer Identification No.) |
3500 Deer Creek Road
Palo Alto, California 94304
(Address of principal executive offices, including zip code)
(650) 681-5000
(Registrant’s telephone number, including area code)
(Former name or former address, if changed since last report)
Check the appropriate box below if the Form 8-K filing is intended to simultaneously satisfy the filing obligation of the registrant under any of the following provisions (see General Instruction A.2):
| ¨ | Written communications pursuant to Rule 425 under the Securities Act (17 CFR 230.425) |
| ¨ | Soliciting material pursuant to Rule 14a-12 under the Exchange Act (17 CFR 240.14a-12) |
| ¨ | Pre-commencement communications pursuant to Rule 14d-2(b) under the Exchange Act (17 CFR 240.14d-2(b)) |
| ¨ | Pre-commencement communications pursuant to Rule 13e-4(c) under the Exchange Act (17 CFR 240.13e-4(c)) |
| Item 2.02 | Results of Operations and Financial Condition. |
On November 3, 2015, Tesla Motors, Inc. released its financial results for the quarter ended September 30, 2015 by posting its Third Quarter 2015 Shareholder Letter on its website. The full text of the shareholder letter is attached hereto as Exhibit 99.1 and is incorporated herein by reference.
This information is intended to be furnished under Item 2.02 of Form 8-K, “Results of Operations and Financial Condition” and shall not be deemed “filed” for purposes of Section 18 of the Securities Exchange Act of 1934, as amended (the “Exchange Act”), or incorporated by reference in any filing under the Securities Act of 1933, as amended, or the Exchange Act, except as shall be expressly set forth by specific reference in such a filing.
| Item 9.01 | Financial Statements and Exhibits. |
| (d) | Exhibits. |
| Exhibit No. |
Description | |
| 99.1 | Tesla Motors, Inc. Third Quarter 2015 Shareholder Letter dated November 3, 2015. | |
SIGNATURES
Pursuant to the requirements of the Securities Exchange Act of 1934, the registrant has duly caused this report to be signed on its behalf by the undersigned hereunto duly authorized.
| TESLA MOTORS, INC. | ||
| By: |
/s/ Deepak Ahuja | |
| Deepak Ahuja Chief Financial Officer | ||
Date: November 3, 2015
EXHIBIT INDEX
| Exhibit No. |
Description | |
| 99.1 | Tesla Motors, Inc. Third Quarter 2015 Shareholder Letter dated November 3, 2015 | |
Exhibit 99.1

|
Tesla Motors – Third Quarter 2015 Shareholder Letter
• Model X launch & start of deliveries • Autopilot released to 40,000 vehicles globally, over the air • Produced a record 13,091 vehicles, despite one week shut down • Delivered a record 11,603 new vehicles • Gigafactory construction and production ahead of schedule • Model 3 unveiling planned for late March 2016 |
November 3, 2015
Dear Fellow Shareholders:
| Vehicle electrification and autonomous driving are crucial to sustainable and safe personal transportation; plus these technologies make driving more enjoyable. Recently, Tesla introduced two new groundbreaking innovations that advance driving on these fronts. |
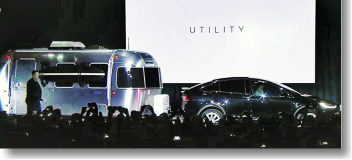
| In September, we launched our third vehicle, Model X, featuring a combination of safety, performance and convenience that is unmatched by any other sport utility vehicle (SUV). Model X demonstrates that any vehicle type can be successfully electrified, even a large SUV that seats seven adults, carries all their gear and can tow up to 5,000 lbs. With such a comprehensive mix of best-in-class capabilities Model X also proves, just as Model S does, that electric drive leads to better vehicles. |
| We also recently released a vehicle software update that delivers a range of new Autopilot features. These features relieve drivers of the most tedious and potentially dangerous aspects of road travel. As a beta release, Autopilot is designed to improve over time, and marks an important step toward a future of autonomous driving. |
| Such innovations define new frontiers for the automotive industry, but more importantly, they improve personal transportation for everyone. |
| Model X and Autopilot Expand Demand |
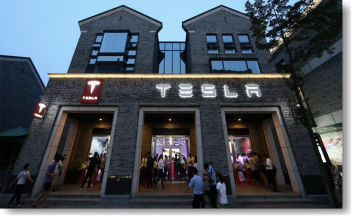
| In Q3, global Model S orders increased by more than 50% from a year ago, and grew at a faster pace in North America, Europe and Asia, than during Q2. In China, our newest major market, Q3 Model S orders increased substantially from Q2, due in part to the opening of two new retail locations. We expect order growth in China to remain strong with more store openings and the recent policy changes in Beijing and other major cities that allow buyers of Tesla vehicles to bypass license plate restrictions. |
| Our customers and reservation holders are enthusiastically embracing the new features of Model X. In addition to the unique falcon wing doors that improve vehicle access and a panoramic windshield that transforms the interior of the cabin, our internal crash testing shows that Model X should receive the best ever safety ratings for an SUV. Model X also has ludicrously fast acceleration and hospital-grade cabin air quality - all in a vehicle with an estimated EPA single charge range of up to 257 miles for the 90kWh pack option. Consequently, Model X Signature Series reservation holders are converting to firm production orders at a much higher rate than we witnessed with Model S. |
Model X – World’s First EV with Towing Capability |
|
Hangzhou, China Store |
Since the Model X launch event, order rates have accelerated for both Model S and Model X. Although it is too early to draw firm conclusions, this supports our belief that Model X expands the market for Tesla vehicles, with little to no cannibalization of Model S.
Version 7.0 software released over the air in October has delivered a significant visual update to the digital displays of the entire Model S fleet. The release also enabled Autopilot on about 40,000 Model S and Model X vehicles globally, giving these cars the ability to steer within a lane, change lanes with a tap of a turn signal and parallel park autonomously. Autopilot also reduces front and side collision risk and helps keep the car on the road should the driver become distracted. | |
| Thousands of Autopilot-equipped Tesla vehicles are gathering over one million miles of driving data per day. We then analyze this data and feed it back to the fleet to continually improve our customers’ driving experiences. Autopilot is so advanced and unique that test drive requests from prospective customers have increased significantly since its introduction. To manage this volume of requests efficiently, consumers can now schedule their own test drives online, representing another industry-first by Tesla. | ||
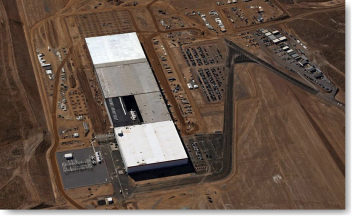
| Tesla Energy Production Begins at the Gigafactory | ||
| We began production of Tesla Energy products in Q3 at our Fremont factory, with a long-term plan to shift production to the Gigafactory. Faced with growing demand for Powerpacks and Powerwalls, we have accelerated our plans to expand manufacturing capacity. In early Q4 we relocated production from Fremont to an automated assembly line at the Gigafactory. This positions us for strong growth in 2016, but the Gigafactory pull-ahead will push some Tesla Energy Q4 production and deliveries into Q1. | ||
| We are seeing very strong demand for Tesla Energy products globally, and particularly in Australia, Germany and South Africa. To respond to these opportunities, we are growing our worldwide Tesla Energy sales team and are continuing to sign new business partnerships with utilities and energy companies. There is also an exciting market opportunity for us in India with strong government alignment that we look forward to growing in 2016. Recent changes to feed-in tariff structures in Hawaii also create a large new storage market in that state. | ||
| We have also accelerated plans to begin cell production for Tesla Energy products at the Gigafactory by the end of 2016. This is several quarters ahead of our initial plan.
In conjunction with development of the Gigafactory, we recently signed two conditional purchase orders for lithium hydroxide in order to promote sourcing of this commodity at lower cost and with reduced environmental impact. We are planning on establishing further supplier arrangements with the intent of having a robust, flexible and cost effective supply chain in place for our long-term needs. |
Gigafactory – Reno, Nevada | |
| Q3 Results | ||
| Total Q3 non-GAAP revenue was $1.24 billion for the quarter, up nearly 33% from a year ago, while GAAP revenue was $937 million. Total Q3 gross margin was 25.1% on a non-GAAP basis and 24.7% on a GAAP basis. | ||
| Automotive revenue was $1.16 billion on a non-GAAP basis, and comprises GAAP Automotive revenue of $853 million plus a net increase of $307 million in deferred revenue as a result of lease accounting. Leasing was more popular in North America during Q3, but the percentage of Tesla direct leasing declined as our leasing partner absorbed more than the sequential increase in leases. Tesla directly leased 494 cars to customers in Q3, worth $45 million of aggregate transaction value. | ||
| Q3 Automotive gross margin excluding $39 million of ZEV credit revenue was 23.7% on a non-GAAP basis and 22.8% on a GAAP basis, in line with our expectations. As anticipated, the average selling price of Model S declined slightly with the first full quarter of deliveries of our lower priced 70 kWh variants of Model S. Our warranty reserves were generally in line with the prior quarter, based on our analysis of projected warranty costs. | ||
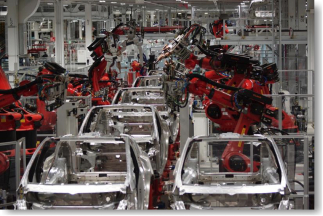
| In Q3, we exceeded our plan by producing 13,091 vehicles, including our first Model X vehicles, despite a one-week shut down to expand manufacturing capacity. During the factory shut down, we retooled our final assembly line to increase throughput by over 35%, completed and commissioned our new paint shop, enabled new stamping equipment and launched Model X on its own new robotic body line.
During the quarter, we delivered 11,603 vehicles, slightly above the number estimated in our October announcement. To support higher Q4 deliveries, we increased vehicles in transit resulting in higher finished goods inventory at the end of Q3. However, the number of “delivery days” in transit based on our Q4 deliveries outlook remained flat compared to the prior quarter at about one month. Consistent with our past reporting, finished goods inventory also includes cars currently used in marketing and as service loaners that will eventually be sold, trade-in Tesla cars and in-transit units of Daimler powertrains and Tesla Energy products. |
Model X Bodies in Production | |
| Q3 Services and Other revenue was $84 million, up 62% from a year ago. This includes $33 million of pre-owned Model S sales. The number of pre-owned Tesla vehicles that we sold in Q3 exceeded the number of customer trade-ins that we received, leading to a 17% sequential reduction in trade-in unit inventory. Q3 Services and Other gross margin increased sequentially to 9.1%. | ||
| Our operating expenses in Q3 were $363 million on a non-GAAP basis, up 5% from Q2. Research and development expenses declined sequentially as Model X development work diminished during the quarter. GAAP operating expenses were $415 million and include $52 million of non-cash stock based compensation. Stock based compensation increased sequentially as it became highly probable that we will achieve certain operational milestones in the near-future and because of grants to new employees. | ||
| Our Q3 non-GAAP net loss was $75 million, or a loss of $0.58 per basic share based on 129 million basic shares, while our Q3 GAAP net loss was $230 million or a loss of $1.78 per basic share. Both figures include a $15 million loss, or almost $0.12 per basic share, related mostly to unrealized losses from revaluation of our foreign currency holdings and finished goods inventory held by our foreign entities. Q3 weakness in the Norwegian krone, Canadian dollar and Chinese yuan had the largest impacts. | ||
| Cash and cash equivalents were $1.4 billion at the end of the quarter, up $275 million sequentially, as a result of our equity offering that raised $739 million net of fees. This was offset by capital expenditures of $392 million and the repayment of the entire $50 million drawn against our asset based credit line in Q3. Capital expenditures were primarily for the capacity expansion and tooling associated with Model X, as well as for the construction of the Gigafactory. | ||
| Our GAAP cash outflow from operations during the quarter was $203 million, but this does not include $163 million in cash inflows from vehicle sales to our bank leasing partners. Furthermore, $31 million of cash was consumed by our direct leasing business funded by Tesla, and is included in cash flow from operations. Adjusting for the impact of our leasing and financing business, our core business was almost breakeven on cash generated in Q3 prior to capital expenditures. | ||
| Outlook | ||
| In Q4, we plan to build 15,000 to 17,000 vehicles, and deliver 17,000 to 19,000 vehicles, which will result in 50,000 to 52,000 total deliveries for the year. | ||
| Model S production and deliveries are on track to achieve our initial Q4 plan. The primary limiting factor to higher Q4 deliveries is the near term ramp of Model X production, with the biggest constraint being the supply of components related to the second row monopost seats. To eliminate these supply constraints and achieve a better overall outcome, we have brought manufacturing of these seats in-house. In addition we, and some of our other Model X suppliers, are still ramping up and fine-tuning production. These factors add uncertainty to our build plans during Q4, but we feel emphasizing quality is the right decision for our customers. | ||
| We expect that Model X will achieve steady state production capacity during Q1 as we do not foresee any significant production, design or supply chain constraints that will impact this plan. Looking ahead, we still remain highly confident of average production and deliveries of 1,600 to 1,800 vehicles per week for Model S and Model X combined during 2016. | ||
| We expect our average vehicle sales price to increase slightly in Q4 with more deliveries of highly optioned Model X vehicles. We expect Q4 Model S gross margin to improve sequentially, but initial Model X launch expenses and higher overhead and depreciation allocations will temporarily elevate total production costs in Q4. As a result, we expect non-GAAP Automotive gross margin to decline slightly from Q3. After Model X production stabilizes in Q1 2016, we expect Model X gross margin to improve rapidly and become comparable to Model S gross margin over the next several quarters, even as we launch a lower priced version of Model X with a smaller battery pack during 2016. Finally, we expect gross margin in Services and Other to remain positive, but to vary within a relatively wide band given the diversity of businesses reflected in this measure. | ||
| In Q4, we expect to directly lease about the same percentage of cars that we did in Q3. As always, we will use lease accounting for these cars even in our non-GAAP financial results, as such treatment is consistent with the cash collected on these transactions. We do not expect to sell any ZEV credits in Q4. | ||
| During the next several quarters, operating leverage should improve with revenue and gross profit both growing faster than operating expenses. Operating expenses should increase slightly in Q4, but reflect a further decline in Model X development expenses, offset by increased costs related to expanding our global sales capability and developing Model 3. We are on track to unveil Model 3 in late March 2016. | ||
| We plan to invest about $500 million in Q4, which will bring the projected total capital expenditures for this year to about $1.7 billion. The increase in spending is primarily due to accelerated investments in the Gigafactory, further vertical integration of seat assembly and other manufacturing activities, as well as faster milestone execution by certain suppliers for Model X manufacturing equipment and tooling. | ||
| Our customers drove their cars almost 250 million miles this quarter, for a total of nearly 1.5 billion miles to date. We are looking forward to the day when we can tell you how far our cars have driven our customers, and to the introduction of many more innovative products manufactured and sold globally. | ||

|

| |
| Elon Musk, Chairman & CEO | Deepak Ahuja, Chief Financial Officer | |
Webcast Information
Tesla will provide a live webcast of its third quarter 2015 financial results conference call beginning at 2:30 p.m. PT on November 3, 2015, at ir.teslamotors.com. This webcast will also be available for replay for approximately one year thereafter.
Forward-Looking Statements
Certain statements in this shareholder letter, including statements in “Outlook” section; statements relating to the progress Tesla is making with respect to product development, including future Autopilot features and functionality and Model X development and delivery plans; statements regarding growth in the number of Tesla store, service center and Supercharger locations; statements relating to the production and delivery timing of Tesla Energy products, as well as future products such as Model 3; growth in demand and orders for Tesla vehicles such as Model X, and the catalysts for that growth; the ability to achieve vehicle demand, volume, production, delivery, revenue, leasing, average sales price, gross margin, spending, capital expenditure and profitability targets; productivity improvements and capacity expansion plans; and Tesla Gigafactory timing, plans and output expectations, including those related to battery module and pack production, are “forward-looking statements” that are subject to risks and uncertainties. These forward-looking statements are based on management’s current expectations, and as a result of certain risks and uncertainties, actual results may differ materially from those projected. The following important factors, without limitation, could cause actual results to differ materially from those in the forward-looking statements: the risk of delays in the manufacture, production and delivery of Model S and Model X vehicles, and production and delivery of Model 3 vehicles; Tesla’s future success depends on its ability to design and achieve market acceptance of Model S and its variants, as well as new vehicle models, specifically Model X and Model 3; the ability of suppliers to meet quality and part delivery expectations at increasing volumes; adverse foreign exchange movements; any failures by Tesla vehicles to perform as expected or if product recalls occur; Tesla’s ability to continue to reduce or control manufacturing and other costs; consumers’ willingness to adopt electric vehicles; competition in the automotive market generally and the alternative fuel vehicle market in particular; Tesla’s ability to establish, maintain and strengthen the Tesla brand; Tesla’s ability to manage future growth effectively as we rapidly grow, especially internationally; the unavailability, reduction or elimination of government and economic incentives for electric vehicles; Tesla’s ability to establish, maintain and strengthen its relationships with strategic partners such as Panasonic; potential difficulties in finalizing, performing and realizing potential benefits under definitive agreements for the Tesla Gigafactory site, obtaining permits and incentives, negotiating terms with technology, materials and other partners for Gigafactory, and maintaining Gigafactory implementation schedules, output and costs estimates; and Tesla’s ability to execute on its retail strategy and for new store, service center and Tesla Supercharger openings. More information on potential factors that could affect our financial results is included from time to time in our Securities and Exchange Commission filings and reports, including the risks identified under the section captioned “Risk Factors” in our quarterly report on Form 10-Q filed with the SEC on August 7, 2015. Tesla disclaims any obligation to update information contained in these forward-looking statements whether as a result of new information, future events, or otherwise.
| Investor Relations Contact: | Press Contact: | |||
| Jeff Evanson | Khobi Brooklyn | |||
| Investor Relations – Tesla | Communications – Tesla | |||
| ir@teslamotors.com | press@teslamotors.com |
Tesla Motors, Inc.
Condensed Consolidated Statements of Operations
(Unaudited)
(In thousands, except per share data)
| Three Months Ended | Nine Months Ended | |||||||||||||||||||
| Sept 30, 2015 |
June 30, 2015 |
Sept 30, 2014 |
Sept 30, 2015 |
Sept 30, 2014 |
||||||||||||||||
| Revenues |
||||||||||||||||||||
| Automotive (1A) |
$ | 852,555 | $ | 878,090 | $ | 799,915 | $ | 2,623,965 | $ | 2,116,616 | ||||||||||
| Services and other |
84,234 | 76,886 | 51,889 | 207,680 | 125,079 | |||||||||||||||
|
|
|
|
|
|
|
|
|
|
|
|||||||||||
| Total revenues |
936,789 | 954,976 | 851,804 | 2,831,645 | 2,241,695 | |||||||||||||||
|
|
|
|
|
|
|
|
|
|
|
|||||||||||
| Cost of revenues |
||||||||||||||||||||
| Automotive (1B) |
628,729 | 666,386 | 552,987 | 1,926,860 | 1,509,052 | |||||||||||||||
| Services and other |
76,564 | 75,220 | 46,966 | 199,846 | 112,669 | |||||||||||||||
|
|
|
|
|
|
|
|
|
|
|
|||||||||||
| Total cost of revenues (2) |
705,293 | 741,606 | 599,953 | 2,126,706 | 1,621,721 | |||||||||||||||
|
|
|
|
|
|
|
|
|
|
|
|||||||||||
| Gross profit |
231,496 | 213,370 | 251,851 | 704,939 | 619,974 | |||||||||||||||
| Operating expenses |
||||||||||||||||||||
| Research and development (2) |
178,791 | 181,712 | 135,873 | 527,657 | 325,135 | |||||||||||||||
| Selling, general and administrative (2) |
236,367 | 201,846 | 155,107 | 633,578 | 406,690 | |||||||||||||||
|
|
|
|
|
|
|
|
|
|
|
|||||||||||
| Total operating expenses |
415,158 | 383,558 | 290,980 | 1,161,235 | 731,825 | |||||||||||||||
|
|
|
|
|
|
|
|
|
|
|
|||||||||||
| Loss from operations |
(183,662 | ) | (170,188 | ) | (39,129 | ) | (456,296 | ) | (111,851 | ) | ||||||||||
| Interest income |
327 | 247 | 300 | 758 | 907 | |||||||||||||||
| Interest expense |
(29,308 | ) | (24,352 | ) | (29,062 | ) | (80,234 | ) | (72,183 | ) | ||||||||||
| Other income (expense), net |
(15,431 | ) | 13,233 | (3,090 | ) | (24,503 | ) | 2,401 | ||||||||||||
|
|
|
|
|
|
|
|
|
|
|
|||||||||||
| Loss before income taxes |
(228,074 | ) | (181,060 | ) | (70,981 | ) | (560,275 | ) | (180,726 | ) | ||||||||||
| Provision for income taxes |
1,784 | 3,167 | 3,727 | 7,991 | 5,685 | |||||||||||||||
|
|
|
|
|
|
|
|
|
|
|
|||||||||||
| Net loss |
$ | (229,858 | ) | $ | (184,227 | ) | $ | (74,708 | ) | $ | (568,266 | ) | $ | (186,411 | ) | |||||
|
|
|
|
|
|
|
|
|
|
|
|||||||||||
| Net loss per common share, basic and diluted |
$ | (1.78 | ) | $ | (1.45 | ) | $ | (0.60 | ) | $ | (4.47 | ) | $ | (1.50 | ) | |||||
|
|
|
|
|
|
|
|
|
|
|
|||||||||||
| Shares used in per share calculation, basic and diluted |
129,006 | 126,689 | 124,911 | 127,225 | 124,217 | |||||||||||||||
|
|
|
|
|
|
|
|
|
|
|
|||||||||||
Notes:
| (1) | Due to the application of lease accounting for Model S vehicles with the resale value guarantee or similar buy-back terms, the following is supplemental information for the periods presented: |
| (A) Net increase in deferred revenue and other long-term liabilities as a result of lease accounting and therefore not recognized in automotive sales |
$ | 307,048 | $ | 242,147 | $ | 80,544 | $ | 712,871 | $ | 261,212 | ||||||||||
|
|
|
|
|
|
|
|
|
|
|
|||||||||||
| (B) Net increase in operating lease vehicles as a result of lease accounting and therefore not recognized in automotive cost of sales |
$ | 221,268 | $ | 174,242 | $ | 63,981 | $ | 509,333 | $ | 202,476 | ||||||||||
|
|
|
|
|
|
|
|
|
|
|
The table above excludes assumed net warranty and stock based compensation amounts included in non-GAAP cost of sales.
| (2) | Includes stock-based compensation expense of the following for the periods presented: |
| Cost of revenues |
$ | 3,828 | $ | 4,820 | $ | 5,383 | $ | 13,249 | $ | 12,401 | ||||||||||
| Research and development |
24,153 | 19,912 | 16,639 | 63,857 | 45,006 | |||||||||||||||
| Selling, general and administrative |
28,052 | 18,603 | 17,136 | 65,288 | 54,572 | |||||||||||||||
|
|
|
|
|
|
|
|
|
|
|
|||||||||||
| Total stock-based compensation expense |
$ | 56,033 | $ | 43,335 | $ | 39,158 | $ | 142,394 | $ | 111,979 | ||||||||||
|
|
|
|
|
|
|
|
|
|
|
|||||||||||
Classification of Revenues and Costs of Revenues
Our income statement reflects the classifications of revenues and costs of revenues to segregate our new vehicle business from our other business activities. “Automotive” revenue and related costs now reflect activities related to the sale or lease of new vehicles including regulatory credits, data connectivity, Autopilot functionality and Supercharging. “Services and other” revenues and related costs include activities such as powertrain sales, service revenue, Tesla Energy and pre-owned Tesla vehicle sales.
Tesla Motors, Inc.
Condensed Consolidated Balance Sheets
(Unaudited)
(In thousands)
| Sept 30, | Dec 31, | |||||||
| 2015 | 2014 | |||||||
| Assets |
||||||||
| Cash and cash equivalents |
$ | 1,426,036 | $ | 1,905,713 | ||||
| Restricted cash and marketable securities - current |
25,223 | 17,947 | ||||||
| Accounts receivable |
119,964 | 226,604 | ||||||
| Inventory |
1,293,717 | 953,675 | ||||||
| Prepaid expenses and other current assets |
133,855 | 94,718 | ||||||
| Operating lease vehicles, net (1) |
1,360,725 | 766,744 | ||||||
| Property and equipment, net |
3,103,811 | 1,829,267 | ||||||
| Restricted cash - noncurrent |
26,355 | 11,374 | ||||||
| Other assets |
57,811 | 43,209 | ||||||
|
|
|
|
|
|||||
| Total assets |
$ | 7,547,497 | $ | 5,849,251 | ||||
|
|
|
|
|
|||||
| Liabilities and Stockholders’ Equity |
||||||||
| Accounts payable and accrued liabilities |
$ | 1,284,300 | $ | 1,046,830 | ||||
| Deferred revenue (2) |
710,378 | 483,922 | ||||||
| Customer deposits |
269,545 | 257,587 | ||||||
| Capital lease obligations |
28,033 | 21,799 | ||||||
| Long-term debt |
2,605,170 | 2,408,084 | ||||||
| Other long-term liabilities (3) |
1,289,234 | 661,123 | ||||||
|
|
|
|
|
|||||
| Total liabilities |
6,186,660 | 4,879,345 | ||||||
| Mezzanine equity (4) |
46,181 | 58,196 | ||||||
| Stockholders’ equity |
1,314,656 | 911,710 | ||||||
|
|
|
|
|
|||||
| Total liabilities and stockholders’ equity |
$ | 7,547,497 | $ | 5,849,251 | ||||
|
|
|
|
|
|||||
Notes:
| (1) | Includes the following increase in operating lease vehicles related to deliveries of Model S and subject to lease accounting, net of depreciation recognized in automotive cost of sales, for the following periods: |
| Resale value guarantee program (and other vehicles with similar buy-back terms) |
||||||||
| Beginning balance |
$ | 689,689 | $ | 376,979 | ||||
| First quarter |
103,022 | 69,743 | ||||||
| Second quarter |
170,025 | 68,752 | ||||||
| Third quarter |
215,337 | 63,981 | ||||||
| Fourth quarter |
110,234 | |||||||
|
|
|
|
|
|||||
| Ending balance |
$ | 1,178,073 | $ | 689,689 | ||||
|
|
|
|
|
|||||
| Model S leasing program |
||||||||
| Beginning balance |
$ | 81,636 | $ | — | ||||
| First quarter |
35,687 | — | ||||||
| Second quarter |
39,587 | 11,214 | ||||||
| Third quarter |
25,162 | 23,824 | ||||||
| Fourth quarter |
46,598 | |||||||
|
|
|
|
|
|||||
| Ending balance |
$ | 182,072 | $ | 81,636 | ||||
|
|
|
|
|
|||||
| (2) | Includes the following increase in deferred revenue related to deliveries of Model S with the resale value guarantee and similar programs and subject to lease accounting, net of revenue amortized to automotive sales, for the following periods: |
| Beginning balance |
$ | 376,471 | $ | 227,868 | ||||
| First quarter |
45,334 | 38,188 | ||||||
| Second quarter |
60,767 | 33,586 | ||||||
| Third quarter |
67,522 | 27,993 | ||||||
| Fourth quarter |
48,836 | |||||||
|
|
|
|
|
|||||
| Ending balance |
$ | 550,094 | $ | 376,471 | ||||
|
|
|
|
|
|||||
| (3) Includes the following increase in other liabilities related to deliveries of Model S with the resale value guarantee and similar programs and subject to lease accounting for the following periods: |
||||||||
| Beginning balance |
$ | 487,879 | $ | 236,298 | ||||
| First quarter |
118,341 | 54,318 | ||||||
| Second quarter |
186,957 | 54,575 | ||||||
| Third quarter |
245,133 | 52,551 | ||||||
| Fourth quarter |
90,137 | |||||||
|
|
|
|
|
|||||
| Ending balance |
$ | 1,038,310 | $ | 487,879 | ||||
|
|
|
|
|
|||||
| (4) | Our common stock price exceeded the conversion threshold price of our convertible senior notes due 2018 (2018 Notes) issued in May 2013; therefore, the 2018 Notes are convertible at the holder’s option during the fourth quarter of 2015. As such, the carrying value of the 2018 Notes was classified as a current liability as of September 30, 2015 and the difference between the principal amount and the carrying value of the 2018 Notes was reflected as convertible debt in mezzanine equity on our condensed consolidated balance sheet as of September 30, 2015. |
Tesla Motors, Inc.
Supplemental Consolidated Financial Information
(Unaudited)
(In thousands)
| Three Months Ended | Nine Months Ended | |||||||||||||||||||
| Sept 30, 2015 |
June 30, 2015 |
Sept 30, 2014 |
Sept 30, 2015 |
Sept 30, 2014 |
||||||||||||||||
| Selected Cash Flow Information |
||||||||||||||||||||
| Cash flows provided by (used in) operating activities (1) |
$ | (203,340 | ) | $ | (159,516 | ) | $ | (27,996 | ) | $ | (494,650 | ) | $ | 29,065 | ||||||
| Cash flows used in investing activities |
(404,090 | ) | (422,837 | ) | (291,643 | ) | (1,259,271 | ) | (618,213 | ) | ||||||||||
| Cash flows provided by financing activities |
893,978 | 218,351 | 33,755 | 1,298,485 | 2,131,805 | |||||||||||||||
| Other Selected Financial Information |
||||||||||||||||||||
| Cash flows provided by (used in) operating activities (1) |
$ | (203,340 | ) | $ | (159,516 | ) | $ | (27,996 | ) | $ | (494,650 | ) | $ | 29,065 | ||||||
| Capital expenditures |
(392,403 | ) | (405,165 | ) | (284,175 | ) | (1,223,628 | ) | (601,224 | ) | ||||||||||
|
|
|
|
|
|
|
|
|
|
|
|||||||||||
| Free cash flow (cash flow from operations plus capital expenditures) (1) |
$ | (595,743 | ) | $ | (564,681 | ) | $ | (312,171 | ) | $ | (1,718,278 | ) | $ | (572,159 | ) | |||||
|
|
|
|
|
|
|
|
|
|
|
|||||||||||
| Depreciation and amortization |
$ | 110,366 | $ | 91,389 | $ | 64,972 | $ | 278,867 | $ | 163,955 | ||||||||||
| Sept 30, 2015 |
June 30, 2015 |
Sept 30, 2014 |
||||||||||
| Cash and Investments |
||||||||||||
| Cash and cash equivalents |
$ | 1,426,036 | $ | 1,150,673 | $ | 2,370,735 | ||||||
| Restricted cash and marketable securities - current |
25,223 | 20,591 | 17,331 | |||||||||
| Restricted cash - noncurrent |
26,355 | 19,774 | 9,090 | |||||||||
| (1) | During the three months ended June 30, 2014, we began separately presenting the effect of exchange rate changes on our cash and cash equivalents in our condensed consolidated statement of cash flows due to our growing operations in foreign currency environments. Prior period amounts have been reclassified to conform to the current period presentation. |
Supplemental Model S Direct Leasing Program Information
(in thousands, except for vehicle deliveries)
| Three Months Ended | Nine Months Ended | |||||||||||||||||||
| Sept 30, 2015 |
June 30, 2015 |
Sept 30, 2014 |
Sept 30, 2015 |
Sept 30, 2014 |
||||||||||||||||
| Vehicles delivered |
494 | 631 | 347 | 1,718 | 505 | |||||||||||||||
| Average per unit price of vehicles delivered |
$ | 91 | $ | 100 | $ | 99 | $ | 100 | $ | 100 | ||||||||||
|
|
|
|
|
|
|
|
|
|
|
|||||||||||
| Aggregate value of vehicles delivered (1) |
$ | 44,804 | $ | 63,127 | $ | 34,490 | $ | 171,290 | $ | 50,536 | ||||||||||
|
|
|
|
|
|
|
|
|
|
|
|||||||||||
| Direct leasing revenue recognized |
$ | 11,514 | $ | 9,228 | $ | 1,117 | $ | 27,211 | $ | 1,287 | ||||||||||
| (1) | Aggregate value is the product of multiplying vehicles delivered by the average per unit price of vehicles delivered |
Non-GAAP Financial Information
This letter includes non-GAAP financial information because we plan and manage our business using such information. Our non-GAAP measures align the recognition of revenues and costs related to a vehicle sale with the time when the customer take delivery of the car and cash is received or owed to us. This contrasts with the approach of other automotive manufacturers who under GAAP accounting recognize revenue when the vehicle is sold into dealership inventory rather than to end customers, even though in the case of a captive finance lease they may not collect cash for several years on a consolidated basis.
Our non-GAAP revenue and gross profit is determined by adding back the deferred revenue and related costs for cars sold with resale value guarantee and where we have collected, or will collect from a bank intermediary in a matter of days, the purchase price of the car in cash. For cars leased directly by Tesla, we recognize lease revenue and related costs over the lease term and the same way for both GAAP and non-GAAP purposes. Our non-GAAP expense and per share information also exclude non-cash interest expense and stock-based compensation.
Tesla Motors, Inc.
Reconciliation of GAAP to Non-GAAP Financial Information
(Unaudited)
(In thousands, except per share data)
| Three Months Ended | Nine Months Ended | |||||||||||||||||||
| Sept 30, 2015 |
June 30, 2015 |
Sept 30, 2014 |
Sept 30, 2015 |
Sept 30, 2014 |
||||||||||||||||
| Net loss (GAAP) |
$ | (229,858 | ) | $ | (184,227 | ) | $ | (74,708 | ) | $ | (568,266 | ) | $ | (186,411 | ) | |||||
| Stock-based compensation expense |
56,033 | 43,335 | 39,158 | 142,393 | $ | 111,979 | ||||||||||||||
| Non-cash interest expense related to convertible notes and other borrowing |
21,850 | 18,171 | 22,160 | 59,531 | $ | 54,192 | ||||||||||||||
|
|
|
|
|
|
|
|
|
|
|
|||||||||||
| Net loss (Non-GAAP) including lease accounting |
(151,975 | ) | (122,721 | ) | (13,390 | ) | (366,341 | ) | (20,240 | ) | ||||||||||
|
|
|
|
|
|
|
|
|
|
|
|||||||||||
| Model S gross profit deferred due to lease accounting (1)(2) |
77,022 | 61,907 | 16,564 | 185,325 | 56,555 | |||||||||||||||
|
|
|
|
|
|
|
|
|
|
|
|||||||||||
| Net income (loss) (Non-GAAP) |
$ | (74,953 | ) | $ | (60,814 | ) | $ | 3,174 | $ | (181,016 | ) | $ | 36,315 | |||||||
|
|
|
|
|
|
|
|
|
|
|
|||||||||||
| Net loss per share, basic (GAAP) |
$ | (1.78 | ) | $ | (1.45 | ) | $ | (0.60 | ) | $ | (4.47 | ) | $ | (1.50 | ) | |||||
| Stock-based compensation expense |
0.43 | 0.34 | 0.31 | 1.12 | 0.90 | |||||||||||||||
| Non-cash interest expense related to convertible notes and other borrowing |
0.17 | 0.14 | 0.18 | 0.47 | 0.44 | |||||||||||||||
| Model S gross profit deferred due to lease accounting (1)(2) |
0.60 | 0.49 | 0.13 | 1.46 | 0.46 | |||||||||||||||
|
|
|
|
|
|
|
|
|
|
|
|||||||||||
| Net income (loss) per share, basic (Non-GAAP) |
$ | (0.58 | ) | $ | (0.48 | ) | $ | 0.02 | $ | (1.42 | ) | $ | 0.30 | |||||||
|
|
|
|
|
|
|
|
|
|
|
|||||||||||
| Shares used in per share calculation, basic (GAAP and Non-GAAP) |
129,006 | 126,689 | 124,911 | 127,225 | 124,217 | |||||||||||||||
|
|
|
|
|
|
|
|
|
|
|
|||||||||||
| Net loss per share, diluted (GAAP) |
$ | (1.78 | ) | $ | (1.45 | ) | $ | (0.52 | ) | $ | (4.47 | ) | $ | (1.32 | ) | |||||
| Stock-based compensation expense |
0.43 | 0.34 | 0.27 | 1.12 | 0.79 | |||||||||||||||
| Non-cash interest expense related to convertible notes and other borrowing |
0.17 | 0.14 | 0.15 | 0.47 | 0.39 | |||||||||||||||
|
|
|
|
|
|
|
|
|
|
|
|||||||||||
| Net loss (Non-GAAP) including lease accounting |
(1.18 | ) | (0.97 | ) | (0.10 | ) | (2.88 | ) | (0.14 | ) | ||||||||||
|
|
|
|
|
|
|
|
|
|
|
|||||||||||
| Model S gross profit deferred due to lease accounting (1)(2) |
0.60 | 0.49 | 0.12 | 1.46 | 0.40 | |||||||||||||||
|
|
|
|
|
|
|
|
|
|
|
|||||||||||
| Net income (loss) per share, diluted (Non-GAAP) |
$ | (0.58 | ) | $ | (0.48 | ) | $ | 0.02 | $ | (1.42 | ) | $ | 0.26 | |||||||
|
|
|
|
|
|
|
|
|
|
|
|||||||||||
| Shares used in per share calculation, diluted (Non-GAAP) |
129,006 | 126,689 | 142,747 | 127,225 | 141,406 | |||||||||||||||
|
|
|
|
|
|
|
|
|
|
|
|||||||||||
| (1) | Includes deliveries of Model S with the resale value guarantee or similar buy-back terms and not deliveries under the Model S leasing program. |
| (2) | Under GAAP, warranty costs are expensed as incurred for Model S vehicle deliveries with the resale value guarantee or similar buy-back terms and subject to lease accounting. For Non-GAAP purposes, an estimated incremental warranty reserve of $12.7 million, $10.2 million and $3.6 million is included for the three months ended September 30, 2015 ,June 30, 2015, and September 30, 2014, respectively. For the nine months ended September 30, 2015 and 2014, an estimated incremental warranty reserve of $29.7 million and $9.1 million is included, respectively. Additionally, stock-based compensation of $2.4 million, $2.3 million and $1.0 million is excluded for non-GAAP purposes for the three months ended September 30, 2015, June 30, 2015, and September 30, 2014, respectively. For the nine months ended September 30, 2015 and 2014, stock-based compensation of $6.3 million and $2.4 million is excluded, respectively. |
Tesla Motors, Inc.
Reconciliation of GAAP to Non-GAAP Financial Information
(Unaudited)
(In thousands, except per share data)
| Three Months Ended | Nine Months Ended | |||||||||||||||||||
| Sept 30, 2015 |
June 30, 2015 |
Sept 30, 2014 |
Sept 30, 2015 |
Sept 30, 2014 |
||||||||||||||||
| Revenues (GAAP) |
$ | 936,789 | $ | 954,976 | $ | 851,804 | $ | 2,831,647 | $ | 2,241,695 | ||||||||||
| Model S revenue deferred due to lease accounting (1) |
307,048 | 242,148 | 80,544 | 712,871 | 261,212 | |||||||||||||||
|
|
|
|
|
|
|
|
|
|
|
|||||||||||
| Revenues (Non-GAAP) |
$ | 1,243,837 | $ | 1,197,124 | $ | 932,348 | $ | 3,544,518 | $ | 2,502,907 | ||||||||||
|
|
|
|
|
|
|
|
|
|
|
|||||||||||
| Gross profit (GAAP) |
$ | 231,496 | $ | 213,370 | $ | 251,851 | $ | 704,939 | $ | 619,974 | ||||||||||
| Model S gross profit deferred due to lease accounting (1)(2) |
77,022 | 61,907 | 16,564 | 185,325 | 56,555 | |||||||||||||||
| Stock-based compensation expense |
3,828 | 4,820 | 5,383 | 13,249 | 12,401 | |||||||||||||||
|
|
|
|
|
|
|
|
|
|
|
|||||||||||
| Gross profit (Non-GAAP) |
$ | 312,346 | $ | 280,097 | $ | 273,798 | $ | 903,513 | $ | 688,930 | ||||||||||
|
|
|
|
|
|
|
|
|
|
|
|||||||||||
| Research and development expenses (GAAP) |
$ | 178,791 | $ | 181,712 | $ | 135,873 | $ | 527,657 | $ | 325,135 | ||||||||||
| Stock-based compensation expense |
(24,153 | ) | (19,912 | ) | (16,639 | ) | (63,857 | ) | (45,006 | ) | ||||||||||
|
|
|
|
|
|
|
|
|
|
|
|||||||||||
| Research and development expenses (Non-GAAP) |
$ | 154,638 | $ | 161,800 | $ | 119,234 | $ | 463,800 | $ | 280,129 | ||||||||||
|
|
|
|
|
|
|
|
|
|
|
|||||||||||
| Selling, general and administrative expenses (GAAP) |
$ | 236,367 | $ | 201,846 | $ | 155,107 | $ | 633,578 | $ | 406,690 | ||||||||||
| Stock-based compensation expense |
(28,052 | ) | (18,603 | ) | (17,136 | ) | (65,288 | ) | (54,572 | ) | ||||||||||
|
|
|
|
|
|
|
|
|
|
|
|||||||||||
| Selling, general and administrative expenses (Non-GAAP) |
$ | 208,315 | $ | 183,243 | $ | 137,971 | $ | 568,290 | $ | 352,118 | ||||||||||
|
|
|
|
|
|
|
|
|
|
|
|||||||||||
| (1) | Includes deliveries of Model S with the resale value guarantee or similar buy-back terms and not deliveries under the Model S leasing program. |
| (2) | Under GAAP, warranty costs are expensed as incurred for Model S vehicle deliveries with the resale value guarantee or similar buy-back terms and subject to lease accounting. For Non-GAAP purposes, an estimated incremental warranty reserve of $12.7 million, $10.2 million and $3.6 million is included for the three months ended September 30, 2015, June 30, 2015, and September 30, 2014, respectively. For the nine months ended September 30, 2015 and 2014, an estimated incremental warranty reserve of $29.7 million and $9.1 million is included, respectively. Additionally, stock-based compensation of $2.4 million, $2.3 million and $1.0 million is excluded for non-GAAP purposes for the three months ended September 30, 2015, June 30, 2015, and September 30, 2014, respectively. For the nine months ended September 30, 2015 and 2014, stock-based compensation of $6.3 million and $2.4 million is excluded, respectively. |
1 Year Tesla Chart |
1 Month Tesla Chart |

It looks like you are not logged in. Click the button below to log in and keep track of your recent history.
Support: +44 (0) 203 8794 460 | support@advfn.com
By accessing the services available at ADVFN you are agreeing to be bound by ADVFN's Terms & Conditions

 Hot Features