Parabolic Stop and Reverse or Parabolic SAR, is sometimes refered to as the Parabolic Time/Price System. The Parabolic SAR works by calculating when there is a higher-than-normal probability of the price switching directions.
Signals are given either above or below the price line depending on the prevailing trend. You can adjust the sensitivity of the chart study by changing "Acceleration" under the edit setting, with 1 being super sensitive, and 0.001 being not very sensitive.
Parameters: Acceleration & MaxAcc.
For additional help on what the different parameters mean, that isn't included on this page, click here.
Parabolic SAR

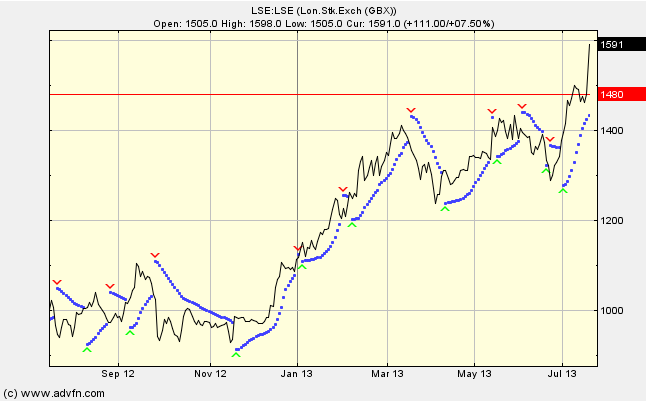
Here is an example of the Parabolic SAR chart study (on a London Stock Exchange graph)
During an uptrend the Parabolic SAR starts at the lowest low [during the previous downtrend], a parabola is then drawn at that price level starting at the current date. As the price rises, so does the Parabolic SAR, and provided it stays under the price level, then we assume that the price is 'on the up'.
Conversely for a downtrend, the Parabolic SAR starts at the highest high [during the previous uptrend], a parabola is then drawn at that price level starting at the current date. As the price falls, so does the Parabolic SAR, and provided it stays above the price level, then we assume that the price is falling.
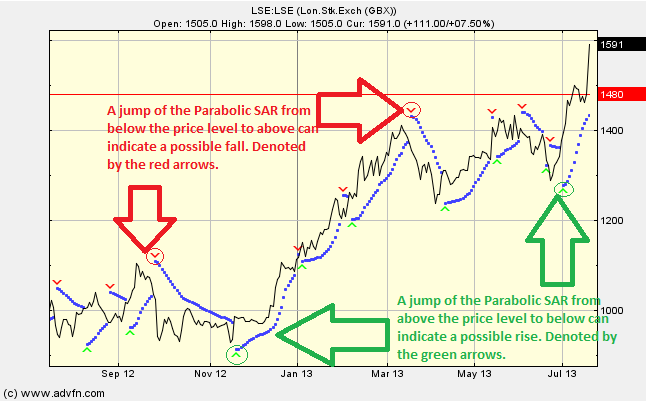
When there is a positive change in the direction of the price level, we see that the Parabolic SAR will jump from above the price level to under the price level, and vice versa. These changes are indicated by the green and red arrows respectively.
Reading the study: Parabolic SAR

Here is an example of a the Parabolic SAR with the price line (of the London Stock Exchange), and what it may indicate

It looks like you are not logged in. Click the button below to log in and keep track of your recent history.
Support: +44 (0) 203 8794 460 | support@advfn.com
By accessing the services available at ADVFN you are agreeing to be bound by ADVFN's Terms & Conditions