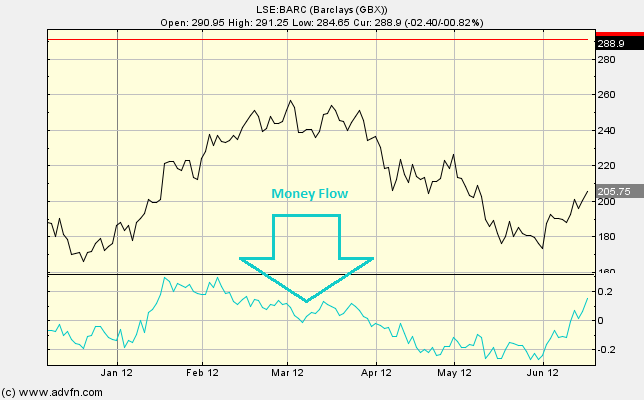
The Money Flow chart study uses both the price level and the Volume, and is used to identify overbought and oversold conditions. The Money flow is defined by dividing the Moving Average of the Accumulation/Distribution of a symbol, by the Moving Average of the Volume. The period for these Moving Averages can eb chosen under 'edit'.
Parameters: Period.
For additional help on what the different parameters mean, that isn't included on this page, click here.
Money Flow

Here is an example of the Money Flow chart study (on a London Stock Exchange graph)
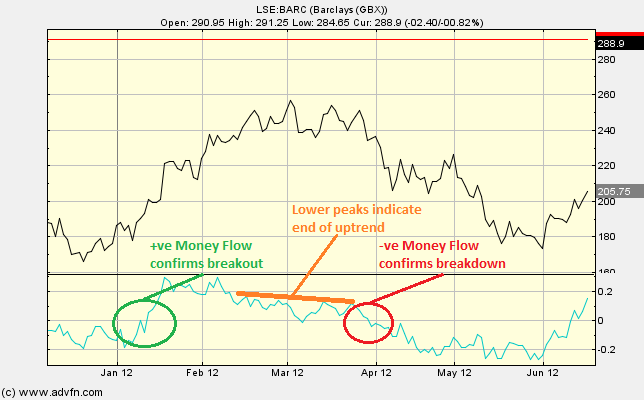
The Money flow is traded similarly to the Chaikin Money Flow, but should avoid possible double signals. The Chaikin Money Flow is often used to confirm breakouts, if a breakout above a resistance level occurs, the Money Flow, just like the Chaikin Money Flow, should have a positive value before you follow it. Similarly, the Money Flow should be negative if you are going to follow a breakdown below a support level.
Subsequently lower (higher) peaks (troughs) can indicate the reversal of an uptrend (downtrend).
Reading the study:

Here is an example of the Money Flow and the price line (for Vodafone), and what it may indicate

It looks like you are not logged in. Click the button below to log in and keep track of your recent history.
Support: +44 (0) 203 8794 460 | support@advfn.com
By accessing the services available at ADVFN you are agreeing to be bound by ADVFN's Terms & Conditions