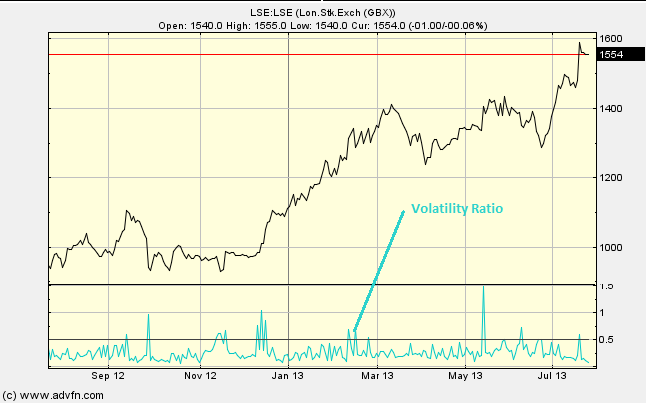
The Volatility Ratio calculates a version of the price range (known as the true range) and then calculates when the price moves out of this range. When the price level moves out of this range then this can be a signal.
Parameters: Period.
For additional help on what the different parameters mean, that isn't included on this page, click here.
Volatility Ratio

Here is an example of the Volatility Ratio chart study (on a London Stock Exchange graph)
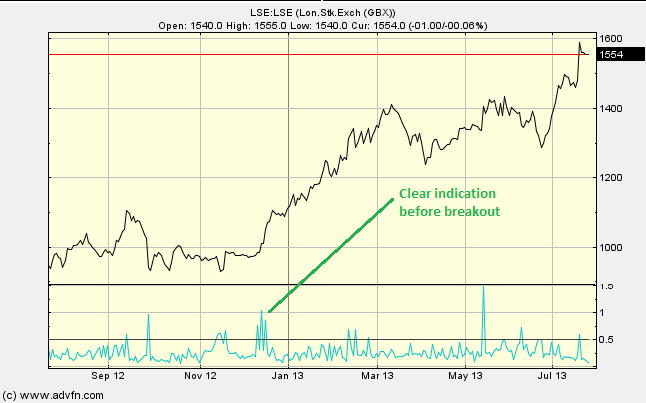
When the Volatility Ratio is 0.5 (or over), this can indicate that a breakout is probable. The exact level can vary depending on the market, but 0.5 is the common figure to focus on as it it when the current true range is double that of the previous true range.
Could use along side one of our Volume Studies to see if the current volume confirms a breakout.
Reading the study:

Here is an example of the Volatility Ratio and the price line (of the London Stock Exchange), and what it may indicate

It looks like you are not logged in. Click the button below to log in and keep track of your recent history.
Support: +44 (0) 203 8794 460 | support@advfn.com
By accessing the services available at ADVFN you are agreeing to be bound by ADVFN's Terms & Conditions