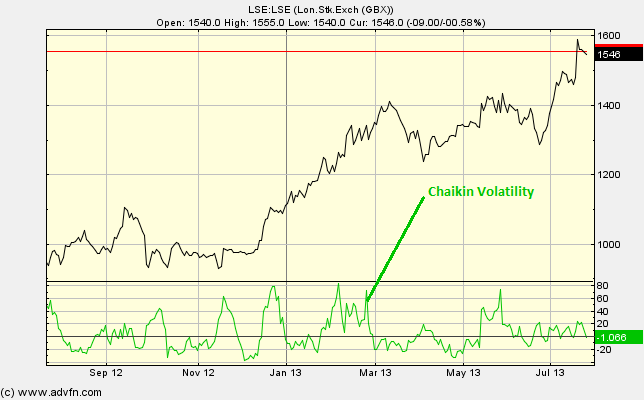
This chart study measures volitility by quantifying a widening of the range [between the highest and lowest price levels for the selected period (the period can be changed under "edit")]. The percentage change is measured, and this percentage is displayed in a graph at the bottom of the chart. Chaikin Volatility differs from the Average True Range as it does not take price gaps into account. The Rate of Change period affects the percentage scale on the verticle axes.
This change, is the percentage change in the Moving Average of the high, versus the low (for the selected time period).
Parameters: Period & Rate of Change Period.
For additional help on what the different parameters mean, that isn't included on this page, click here.
Chaikin Volatility

Here is an example of the Chaikin Volatility chart study (on a London Stock Exchange graph)
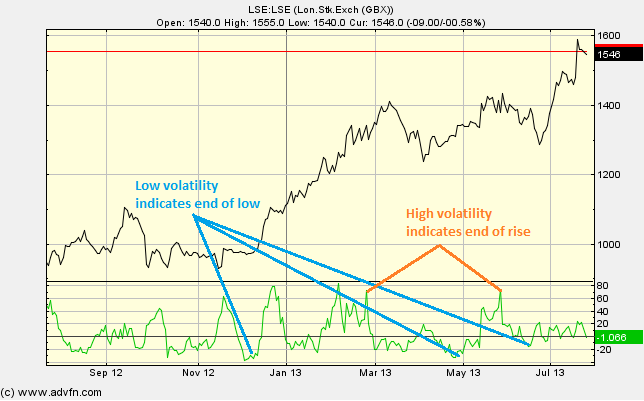
Market tops can be accompanied by a higher volatility, over a long period. Conversely, market bottoms can be accompanied by a decreased volatility, but this time over a shorter period.
Good to use alongside a Moving Average and/or a Band/Channel chart study.
Reading the study:

Here is an example of the Chaikin Volatility and the price line (of the London Stock Exchange), and what it may indicate

It looks like you are not logged in. Click the button below to log in and keep track of your recent history.
Support: +44 (0) 203 8794 460 | support@advfn.com
By accessing the services available at ADVFN you are agreeing to be bound by ADVFN's Terms & Conditions