Hot Features

City Index: Spread Betting, CFD and Forex Trading on 12,000+ global markets including Indices, Shares, Forex and Bitcoin. Click here to find out more.
Citing its near-4% decline from the highs and exhaustion candles beneath its lower Keltner, we highlighted Gold’s potential to mean revert last week. Having rebounded 2.4% from its low, we suspect a corrective top could be in place.
Key points:
- March tends to be a weak month for gold, looking at its seasonal averages
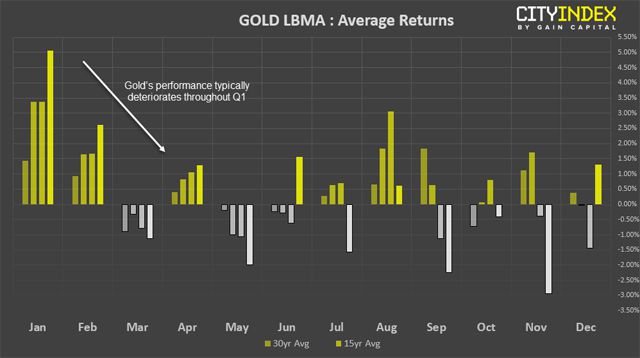
- Gold’s performance typically deteriorates throughout Q1
- Near-term bias remains bearish below 1311.34 – 1314
- Longer-term bias remains bullish, so medium term outlook is pivotal around the $1275 area
Part of the rationale behind a deeper correction was the shift in momentum from the 1346.77 high and how it differed from the previous two corrections.
Previously we said noted:
During this decline, momentum has been dominant on down-days and, as this appears to be the first wave or a correction, we see its potential for it to crash lower still. However, we suspect gold is in for a bounce higher before continuing lower.
Now the bounce has occurred, a bearish engulfing candle (using the open-to close) suggests a swing high could be in place. Moreover, it reinforces the previous comments as the three most volatile sessions have been bearish since the 1376.77 high. Whilst this doesn’t rule out an attempt to break to a new cycle high, we favour the current bounce as corrective and for gold to head for the 1276.84 low on a technical perspective
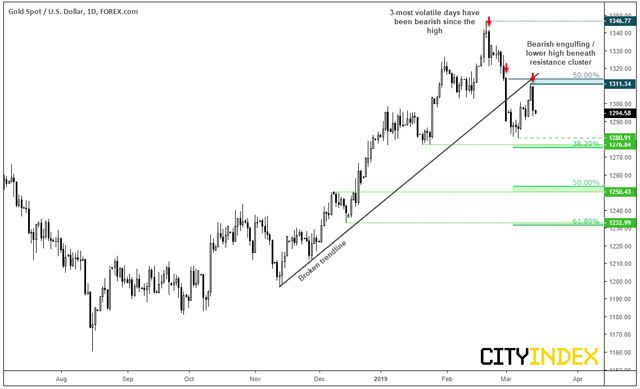
We can see on the daily chart that the 1311.34 high stalled just shy of a 50% retracement level and yesterday’s bearish engulfing candle failed to test its high. This places a zone of resistance between 1311.34 – 1314 and in the vicinity of the broken trendline from the November low. Furthermore, the rise from 1280.81 appears corrective as it has produced 3-waves. If so, this requires a break to new lows, in line with the dominant momentum from the 1346.77 high.
However, keep in mind there’s a 38.2% Fibonacci retracement just beneath the January low which is an acceptable retracement level before it could turn higher. Therefore, how prices react around the 1275 support cluster is pivotal to the medium-term outlook. Ultimately, we see gold trading to new high as the year progresses, although our near-term bias remains bearish. And seasonality tends to point lower for March anyway.
Seasonality could also provide headwind for gold throughout March.
The average return for March hasn’t generally been kind to gold’s performance. Despite typically starting the year on a strong note, average performance drifts lower throughout February before averaging negative returns in March. So there is clearly a down trend of sorts as performance tends to deteriorate as Q1 progresses. Still, these are simply average returns and certainly no predictor of the future, but they do at least show a tendency, which allows us to fine tune our bias with technical analysis.
Over the past 30-years, throughout March, gold has:
- Averaged a -0.89% return (-0.1% median)
- Closed lower 64.5% of occasions
- Posted a negative-month average of -2.8%
With 2 weeks left in the month we see it’s potential to extend losses and close lower. If ad when we see evidence of a base forming, we can look to revert to the bullish side – hopefully just in time for April.