Expected rate cuts from the Fed and further easing from ECB helped stocks to rally in the lead-up to US Independence Day celebrations. Most notably, all three major US indices closed at record highs in unison, providing the President more gleeful tweets through to the early hours.
The trend on the S&P500 remains undeniably bullish, although some measures suggest it could be a little overbought. But breaking to new highs is something we seem to be hearing more frequently. At least, it certainly feels that way. So we thought we’d take a look at past performance after hitting new highs, to see if it really is what it’s cracked up to be.
However, we’ll use a break of a 52-week high and assess forward returns between 1 to 20 days after, as this will provide more signals and allow us to assess the data with a more tradable timeframe in mind.
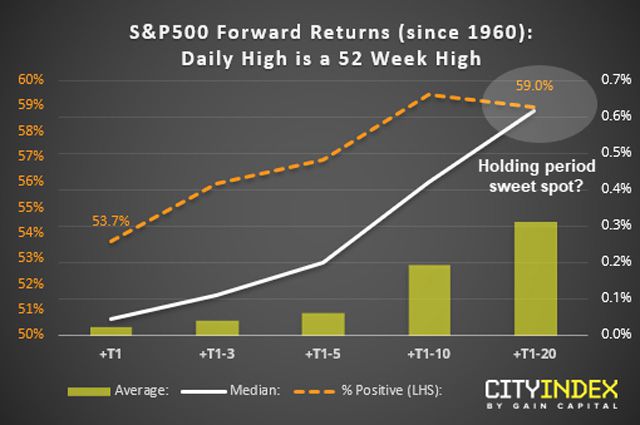
The Event: S&P500 Hits An intraday 52-Week High
Timeframe: Between January 1st 1960 to present
Forward Returns: 1-20 Days after the event
- From this data set, 10.22% of days have seen an intraday, 52-week high since 1960
- Forward returns were all positive between +1 to +20 trading days
- Average and median returns increased further ahead in time
- Median returns peaked between around +2 weeks (+T1-10)
- All ranges showed a positive win rate (above 50%), although this peaked around 2 weeks after a 52-week high (+T1-10)
Takeaway:
- Buy and hold appeals the most
- Holding for around 4-weeks following an intraday-52 week high appears the most desirable, as it has the highest forward returns (average and median) and highest win rate
- Average returns are so small 1 day after it appears to be a flip of a coin
However, an intraday high would also include occasions where it may have closed lower, and perhaps included bearish reversal candles. So we now look at occasions where the S&P500 has closed at a 52-week high.
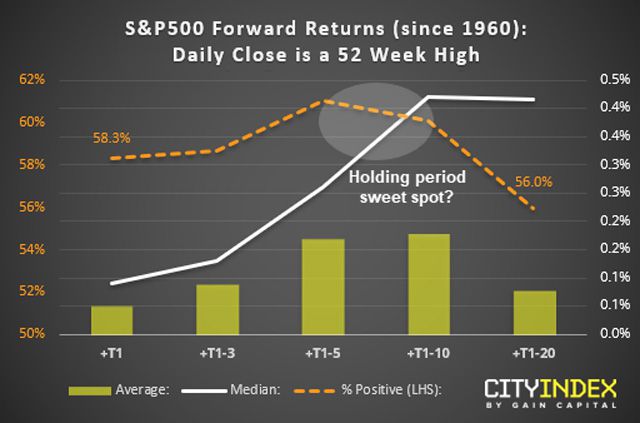
The Event: S&P500 Closes At 52-Week High
Timeframe: Between January 1st 1960 to present
Forward Returns: 1-20 Days after the event
- From this sample, 3.7% of days have closed at a 52-week high since 1960
- Average and median forward returns are all positive
- However, median (typical) returns are much higher, suggesting outlier, bearish days weighed the average down
- Positive returns dip notably around 4-weeks after the event
- The win rate (% positive) peaks around 1 week after the event, and diminishes notably between 2 and 4 weeks later
Takeaway:
- The sweetspot holding time appears to be around 1-2 weeks after the event
- This is based on a trade-off between peak win-rate (1 week) and peak returns (2 weeks)
- It appears less desirable to hold for a month, as it has lowest win rate and 2nd lowest average return. That said, median (typical return) is the 2nd highest.

However, digging a little deeper, we also note that average negative returns outstrip positive returns between 1 day to 4 weeks after the event.
Final Thoughts:
- On average, 52-week highs tend to generate positive returns overall
- However, when negative returns appear, they tend to outweigh positive (and consistent for both intraday highs and closes at a 52-week high)
- This serves as a reminder as to why risk management remains key, as it allows us to minimise downside if those outlier, bearish days materialise
City Index: Spread Betting, CFD and Forex Trading on 12,000+ global markets including Indices, Shares, Forex and Bitcoin. Click here to find out more.