Hot Features

Last week the US finally saw unemployment claims falling more than expected. Despite the fact that declines in jobless claims are not a useful benchmark as to whether the labor markets have returned to normal, it is still good news. But what’s more important is that COVID-19 cases also register a decrease.
ISM Non-Manufacturing PMI wasn’t an exception, growing to 57.1 vs previous 45.4 reading. Producer Prices Index, on the other hand, doesn’t suggest inflation any time soon.
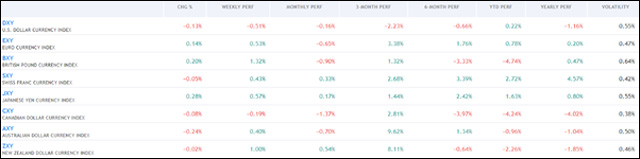
As expected, the RBA left interest rates unchanged at 0.25%, whilst the gold price rallied above $1800 for the first time since 2011. U.S. Treasury Secretary, Steven Mnuchin, mentioned that he expects the Senate to approve yet another coronavirus-related stimulus initiative late this month.
Overall, it was a mixed week in the equity markets with Europe registering slight falls, and the US market growing thanks to technology and long-term growth stocks. The NASDAQ index reached new record heights, whereas the Shanghai Composite Index grew 7,31%.
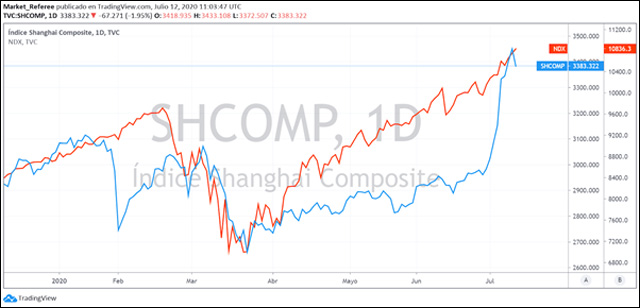
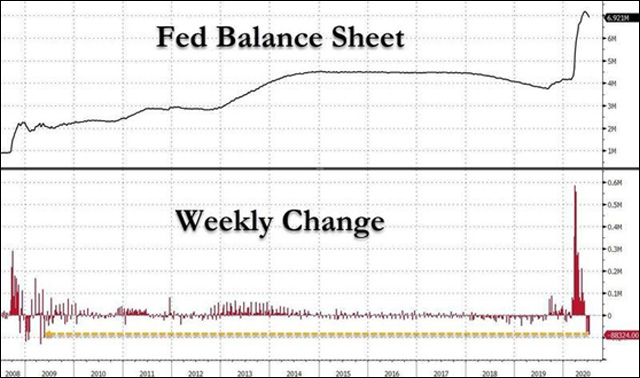
Chart of the week
The US Federal Reserve’s balance sheet size decreased by over $88 billion to $6.97 trillion vs $7.06 trillion a week earlier. The use of one of its key emergency liquidity measures, on the other hand, dropped to zero for the first time since September. The question now is how this will affect the stock market.
It is also important to mention that the fall in the balance sheet wasn’t because of a slowdown in QE but due to a decline in liquidity swaps that fell by $46.3 billion to $179.1 billion.


Macroeconomic Data & Events
We are entering the Q2 earnings season with the five largest banks reporting their results (Bank of America, Morgan Stanley, Goldman Sachs, JPMorgan, Citi, Wells Fargo, and Blackrock). Most probably, their net interest margins remained low throughout the quarter. That is why the market will focus on trading profits and balance sheets.
Besides that, we will keep an eye on policy meetings at the Bank of Japan and the European Central Bank, as well as industrial output data for the world’s largest economies, and retail sales data for the US and China. The inflation data, on the other hand, will suggest whether inflation or deflation is likely to be seen.
GDP data will be released in the UK, China, and Singapore. In the Eurozone, we will get industrial production, inflation, and trade data.
July 13: US monthly budget statement for June; China new yuan loans, total social financing, M2, FDI, vehicle sales for June.
July 14: China trade for June; Japan industrial production for May; Germany and Spain inflation data for June; UK trade balance, industrial output, GDP for May; Euro area industrial output for May; Euro area and Germany ZEW sentiment for July and US inflation and NFIB business optimism index for June.
July 15: UK Visa consumer spending index for June; BoJ monetary policy meeting, quarterly outlook report; UK inflation for June; US industrial output for June and US Fed beige book.
July 16: South Korea and Indonesia interest rate decision; China GDP (Q2), industrial output, retail sales, fixed-asset investment, house price index for June; UK employment change (Apr), jobless rate, average earnings for May; ECB monetary policy meeting and US Philadelphia Fed manufacturing index, housing market index for July.
July 17: Euro area inflation for June and construction output for May