Hot Features
ADA Price Analysis – December 18

An increase in the bears’ pressure may push the price to the support level of $0.98, below it is $0.82 level. Inability to break down the $1.11 by the bears may lead to price reversal and it may increase the price to resistance levels at $1.32, $1.46 and $2.64.
ADA/USD Market
Key Levels:
Resistance levels: $1.32, $1.46, $1.64
Support levels: $1.11, $0.98, $0.82
ADA/USD Long-term Trend: Bearish
Cardano is bearish on daily chart. The bears dominate Cardano market since September. The bearish momentum decrease the price to $1.87 price level on October 27. The decrease was interrupted with the formation of bullish engulfing candle which indicate the buyers’ pressure. Cardano price pulled back to $2.3 level. Bearish movement was restored the following day and the price falls to $1.11.
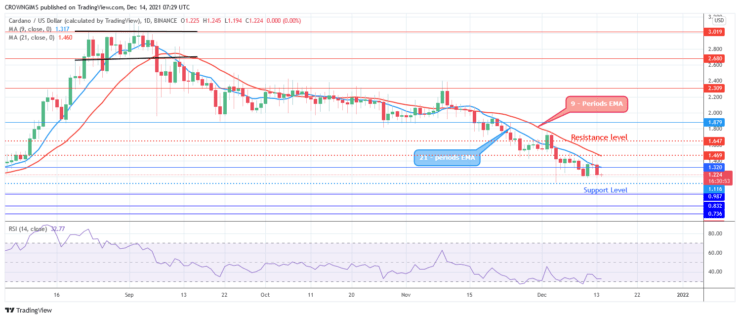
Cardano is trading below the 9 periods EMA and 21 periods EMA after broken down the dynamic support levels. An increase in the bears’ pressure may push the price to the support level of $0.98, below it is $0.82 level. Inability to break down the $1.11 by the bears may lead to price reversal and it may increase the price to resistance levels at $1.32, $1.46 and $2.64. The technical indicator relative Strength Index period 14 is at 30 levels with the signal line pointing downside which indicates a bearish signal.
ADA/USD Medium-term Trend: Bearish
Cardano is on the bearish movement on 4-hour chart. Last week, Cardano was under the control of the bears. The bearish momentum pushes the price down to the support level at $1.32. The level was defended by the bulls with the formation of bullish engulfing candle. The price pulled back and increases toward the resistance level of $1.46.
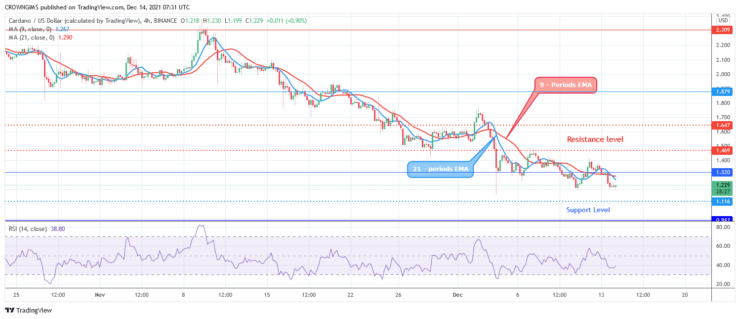
The price is trading below the 9 periods EMA and 21 periods EMA while the two EMAs are crossing each other. The relative strength index period 14 is at 40 levels and the signal line pointing up to indicate buy signal which may be a pullback.
Source: https://learn2.trade