Key Resistance Levels: $1,900, $1,950, $2000
Key Support Levels: $1,750, $1, 700,$1,650

Gold (XAUUSD) Long-term Trend: Ranging
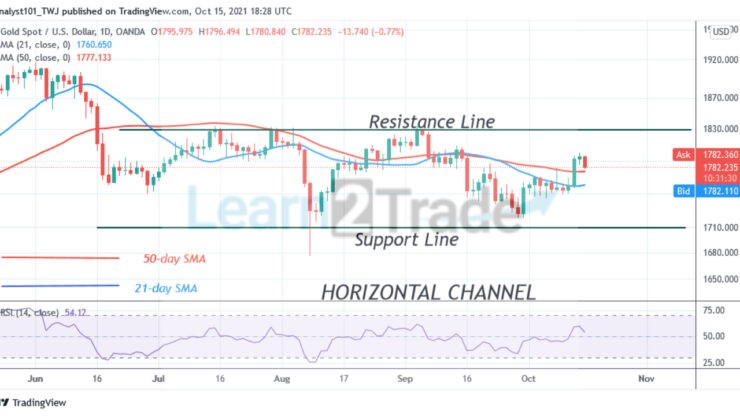
On October 13, the Gold (XAUUSD) price broke above the moving averages and retested the 50-day SMA. This is an indication that the market is likely to rise on the upside. The uptrend is likely to resume on the upside after retesting the 50-day SMA. The market will rise to retest the $1,820 overhead resistance. XAUUSD will have an accelerated price movement if the resistance is breached. Gold price will retest the previous high of $1,920. On the other hand, the range-bound move will continue if Gold faces rejection at $1,820 resistance.

Daily Chart Indicators Reading:
The 21-day SMA and the 50-day SMA are sloping horizontally indicating the sideways trend. Gold is at level 53 of the Relative Strength Index period 14. Gold is in the uptrend zone and above the centerline 50. Gold is capable of rising on the upside.
Gold (XAUUSD) Medium-term bias: Bullish
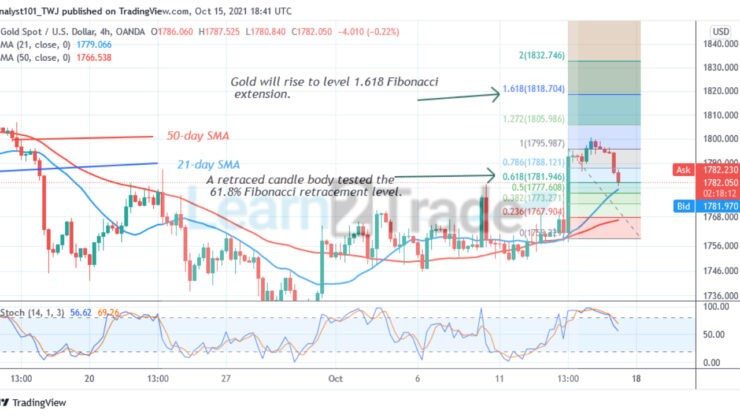
On the 4 hour chart, the Gold price rebounded above $1,757 support and rallied to the high of $1,800. The market has reached the overbought region of the market. Sellers have emerged to push prices down. Meanwhile, on October 13 uptrend; a retraced candle body tested the 61.8% Fibonacci retracement level. The retracement indicates that Gold will rise to level 1.618 Fibonacci extension or $1,818.70 .

4-hour Chart Indicators Reading
Gold is below the 80% range of the daily stochastic. It is in a bearish momentum. The 21-day SMA and the 50-day SMA are sloping upward indicating the uptrend.
General Outlook for Gold (XAUUSD)
Gold’s (XAUUSD) price has resumed an uptrend after breaking above the moving averages. The current uptrend is likely to reach a high of $1,820.Gold may face another rejection at the $1,820 resistance.
Source: https://learn2.trade

 Hot Features


