Major supply zones: $800, $820, $840
Major demand zones: $360, $340, $320

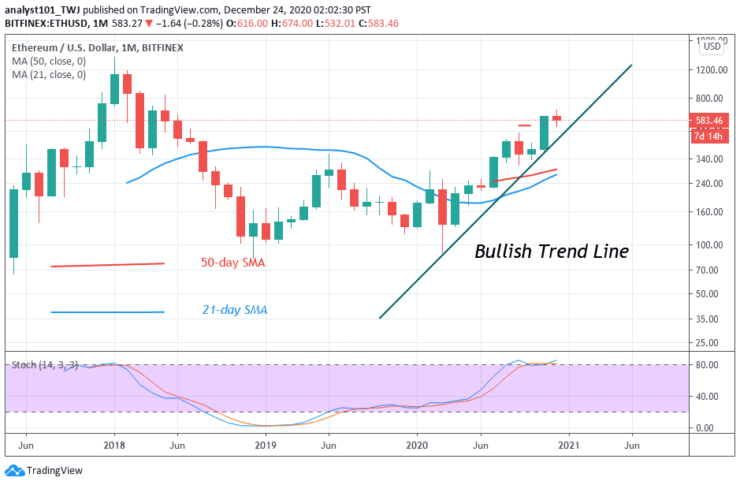
In 2020, Ethereum traded mostly in a bull market. In January, the biggest altcoin has an opening balance of $129 which rose to a high of $287. In March, the biggest altcoin encounter bearish rejection as the coin plunged to $89.66. The bulls bought the dips as they resumed an upward move in April. The coin has risen to $621 in November but it is facing resistance in December.

Ethereum (ETH) Price Predictions: Monthly Chart
Since April, Ether’s price has been making a series of higher highs and higher lows. A trend line is drawn showing the support levels of price. The candlesticks are testing the trend line and trending upward. However, if the price breaks and closes below the support line, the current uptrend is presumed to be terminated. The uptrend will continue as long as the trend line remains unbroken.

Ethereum (ETH) Price Predictions: Weekly Chart
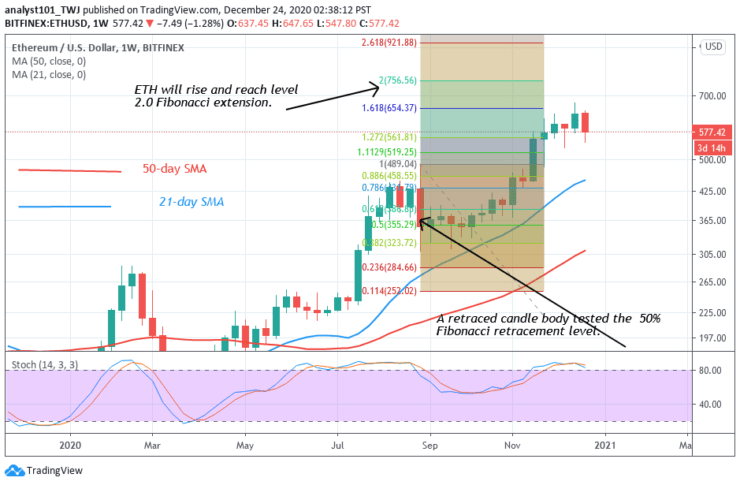
Ethereum is in an upward move, the chart shows the resistance at $440 which was broken in November. A Fibonacci tool has indicated an upward movement of the coin. On the August 10 uptrend, a retraced candle body tested the 50% Fibonacci retracement level. The retracement indicates that the coin will rise and reach level 2.0 Fibonacci extension. That is the coin will reach a high of $756.56.
Conclusion
Analysts believe that Ethereum will be range-bound between $500 and $700 this year. Where Ethereum is heading to in 2021? By end of 2021, Ethereum is likely to reach a high of $2500. This will depend on the growth of Ethereum in 2020. The growth phase can extend to 2021.
Source: https://learn2.trade


