We could not find any results for:
Make sure your spelling is correct or try broadening your search.
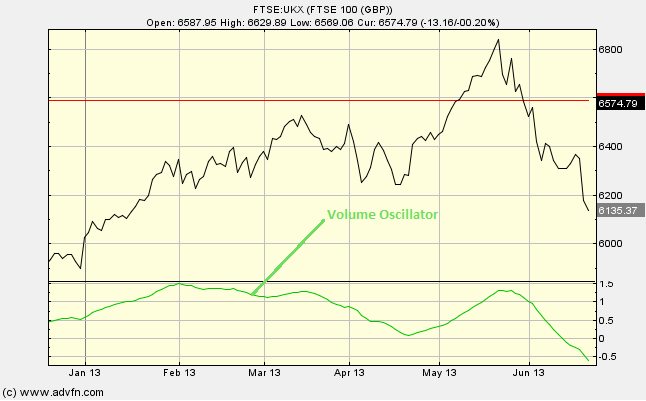
The Volume Oscillator chart study is calculated by looking at the difference between two Moving Averages, set to two different time periods, one fast and one slow (the periods of which can be changed under "edit"). These averages are Moving Averages of the volume.
If the fast Moving Average is above the slow Moving Average the oscillator will be positive. If the fast Moving Average is below the slow Moving Average then the oscillator will be negative. Finally, the Volume Oscillator will be zero when the two Moving Averages cross.
You can select to use the Exponential Moving Average, under 'edit'.
Parameters: Fast and slow period(s) & use Exponential Moving Average (EMA).
For additional help on what the different parameters mean, that isn't included on this page, click here.
Volume Oscillator

Here is an example of the Volume Oscillator chart study (on a FTSE 100 graph)
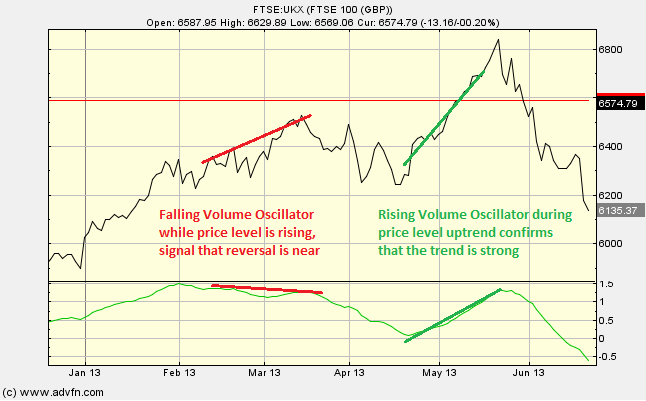
A rising Volume Oscillator signals that the price levels trend is strong, and you would expect to see a high volume if the price level had just broken through support or resistance. While a falling Volume Oscillator indicates that the price levels trend is weakening, and this might be a signal of a potential reversal in trend.
Reading the study:

Here is an example of a Volume Oscillator and the price line (of the FTSE 100), and what it may indicate

It looks like you are not logged in. Click the button below to log in and keep track of your recent history.
Support: +44 (0) 203 8794 460 | support@advfn.com
By accessing the services available at ADVFN you are agreeing to be bound by ADVFN's Terms & Conditions