We could not find any results for:
Make sure your spelling is correct or try broadening your search.
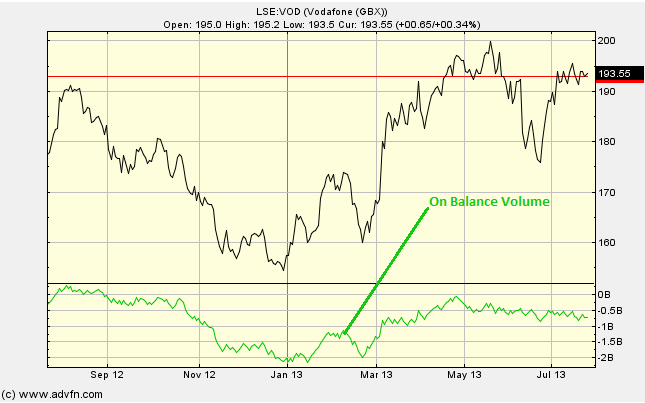
On Balance Volume (OBV) looks at volume flow. This chart study adds volume on 'up' days and subtracts volume on 'down' days. A period's volume is positive when the closing price level is above the previous close, and vice versa.
No parameters.
On Balance Volume

Here is an example of the On Balance Volume chart study (on a Vodafone graph)
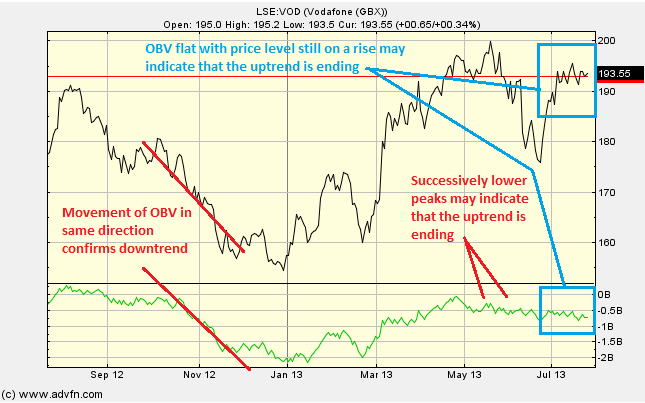
Indicators can be divergence of the OBV from the price level (indicating a possible change in the direction of the price level). For example, if the price level is moving up while the OBV is flat, or moving down, then we may see a change in the direction of the price level. Conversely when the price is on a downtrend.
Also, in a market that is trending upwards (downwards), successively lower (higher) peaks of the OBV may indicate that the trend is due to end.
OBV can also be used to confirm price trends. This is when the OBV is moving in the same direction as the price level.
Reading the study:

Here is an example of the Stochastisc and the price line (for Vodafone), and what it may indicate

It looks like you are not logged in. Click the button below to log in and keep track of your recent history.
Support: +44 (0) 203 8794 460 | support@advfn.com
By accessing the services available at ADVFN you are agreeing to be bound by ADVFN's Terms & Conditions