We could not find any results for:
Make sure your spelling is correct or try broadening your search.
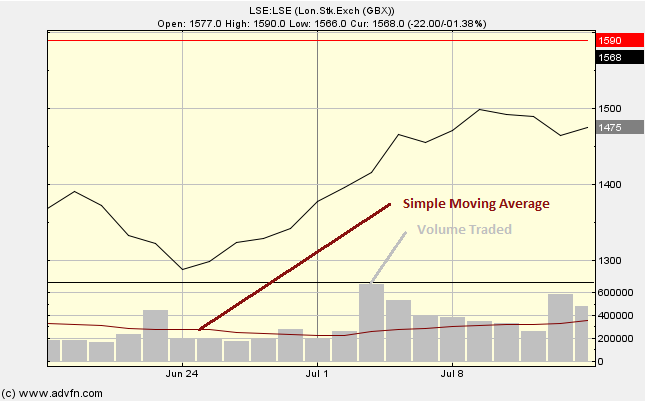
The Volume SMA chart study shows the Simple Moving Average (SMA) chart study, over the Volume [traded] chart study. The Volume is shown in grey.
You can adjust the period of the SMA under 'edit'.
Parameters: Period.
For additional help on what the different parameters mean, that isn't included on this page, click here.
Volume SMA

Here is an example of the Volume SMA chart study (on a London Stock Exchange graph)

It looks like you are not logged in. Click the button below to log in and keep track of your recent history.
Support: +44 (0) 203 8794 460 | support@advfn.com
By accessing the services available at ADVFN you are agreeing to be bound by ADVFN's Terms & Conditions