We could not find any results for:
Make sure your spelling is correct or try broadening your search.
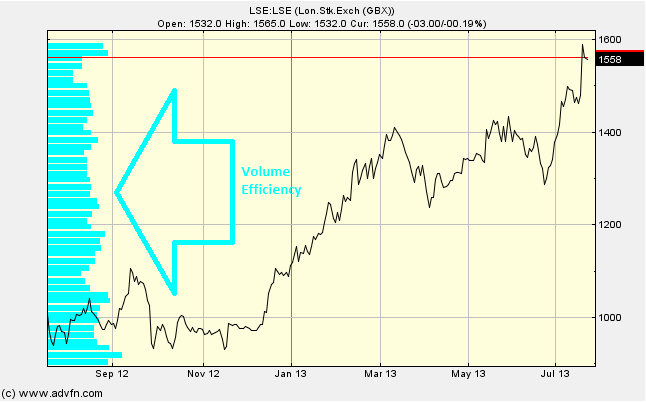
The Volume Efficiency chart study tells us the volume of trade at certain price levels, and indicates which price levels need more or less volume [of trade] to shift the price. This is used in an attempt to detect support and resistance by looking at how much volume it takes to move the price.
For each time period the total volume is divided by the average volume and then divided by the difference between the high and low (as a fraction). The geometric mean of all time periods at the same price level is then plotted. This is plotted like a histogram on the left of the chart.
No Parameters.
Volume Efficiency

Here is an example of the Volume Efficiency chart study (on a London Stock Exchange graph)
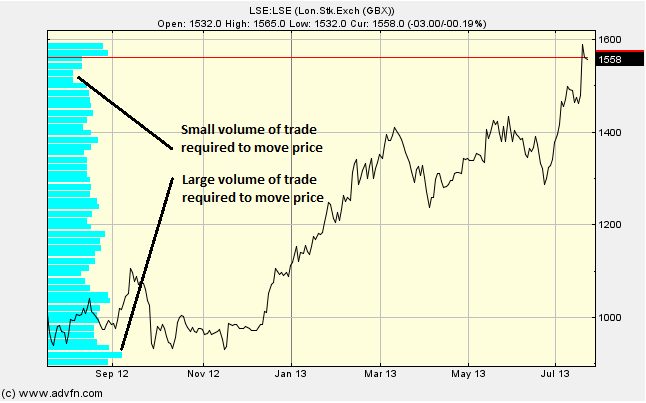
Longer bars indicate price levels which take a larger volume [of trade] to move the price. Conversely, shorter bars indicate price levels where a smaller volume is required to move the price.
Volume Efficiency

Here is an example of the Volume Efficiency and the price line (of the London Stock Exchange), and what it may indicate

It looks like you are not logged in. Click the button below to log in and keep track of your recent history.
Support: +44 (0) 203 8794 460 | support@advfn.com
By accessing the services available at ADVFN you are agreeing to be bound by ADVFN's Terms & Conditions