We could not find any results for:
Make sure your spelling is correct or try broadening your search.
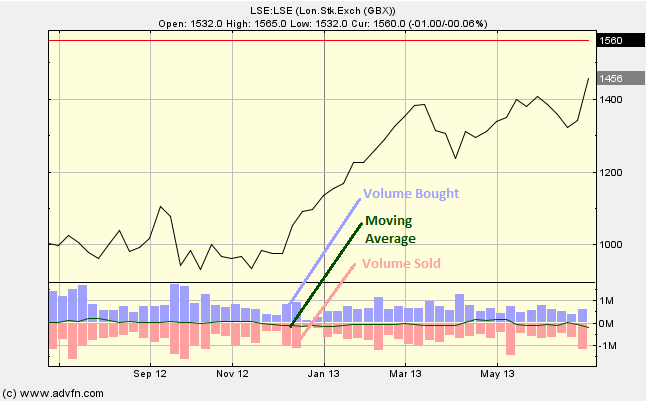
This chart study plots a couple of variables. Firstly the volumes bought and sold over each period, and secondly a Moving Averager. This can either be the Moving Averager of the difference in volume, or the Moving Averager of the ratio of bought/sold volume (you can choose between these under 'edit').
Parameters: Period & either Moving Average or Ratio Moving Average.
For additional help on what the different parameters mean, that isn't included on this page, click here.
Buy/Sell Volume Ratio MA

Here is an example of the Buy/Sell Volume Ratio MA chart study (on a London Stock Exchange graph)
A useful study when looking at a short period. We can monitor quick shifts from buying to selling, or vice versa. In particular, the ratio Moving Average can be useful to gauge sentiment outside of the size of volumes traded.

It looks like you are not logged in. Click the button below to log in and keep track of your recent history.
Support: +44 (0) 203 8794 460 | support@advfn.com
By accessing the services available at ADVFN you are agreeing to be bound by ADVFN's Terms & Conditions