ADVFN Logo ADVFN

We could not find any results for:
Make sure your spelling is correct or try broadening your search.

Trending Now

Toplists

It looks like you aren't logged in.
Click the button below to log in and view your recent history.

Hot Features

Registration Strip Icon for default Register for Free to get streaming real-time quotes, interactive charts, live options flow, and more.

CGT Capital Gearing Trust Plc

4,735.00
0.00 (0.00%)
Last Updated: 08:20:38
Delayed by 15 minutes
Share Name Share Symbol Market Type Share ISIN Share Description
Capital Gearing Trust Plc LSE:CGT London Ordinary Share GB0001738615 ORD 25P
  Price Change % Change Share Price Bid Price Offer Price High Price Low Price Open Price Shares Traded Last Trade
  0.00 0.00% 4,735.00 4,690.00 4,705.00 2,734 08:20:38
Industry Sector Turnover Profit EPS - Basic PE Ratio Market Cap
Unit Inv Tr, Closed-end Mgmt 22.43M 13.74M 0.6453 73.38 1.01B

CAE reports first-quarter results for fiscal year 2006

11/08/2005 4:52pm

PR Newswire (US)


Capital Gearing (LSE:CGT)
Historical Stock Chart


From Jul 2019 to Jul 2024
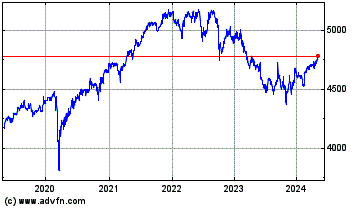
Click Here for more Capital Gearing Charts.
- Revenues increase 15% to $266 million - Financial reporting enhanced with new segmentation - Continued progress on restructuring - Renewal of committed credit facility of US$400 million and Euro 100 million MONTREAL, Aug. 11 /PRNewswire-FirstCall/ -- (NYSE: CGT; TSX: CAE) - CAE today reported financial results for the first quarter, ended June 30, 2005. Earnings from continuing operations were $20.8 million, or $0.08 per share, which compares to first-quarter earnings of $18.9 million or $0.08 per share in the prior fiscal year. All financial information is in Canadian dollars. Excluding non-recurring items, earnings from continuing operations for the quarter were $0.08 per share which on the same basis compares to $0.04 in the first quarter last year. Consolidated revenues from continuing operations reached $266.0 million, compared to $230.9 million in the first quarter last year and $262.7 million in the most recent fourth quarter. The 15% increase in revenues compared to the year-earlier quarter stems mainly from higher Simulation Products revenues in both the Civil and Military segments. "First-quarter results are positive, and are consistent with our initial outlook for the year," said Robert E. Brown, CAE's President and CEO. "We are encouraged by the general level of activity we see in the commercial and business aviation markets, and we are determined to emerge from this transition year with a solid base to benefit fully from any market recovery." Aside from the improvements in revenues and earnings from continued operations, Mr. Brown noted that the underlying performance of the Company's various business groups was solid, with consolidated operating income (EBIT) up 14% compared to the first quarter of fiscal 2005. "We continue to make progress with our restructuring," Mr. Brown added. "CAE's financial strategy and position are sound, as reflected in our reduced debt load and the recently concluded agreement for a new, committed five-year revolving credit facility. We have implemented strict business processes that emphasize specific financial targets, our businesses are now organized more effectively with a clear path to improvement and our cost structure is leaner. In addition, I am confident that we are taking the right steps towards re- engaging our workforce." New financial segmentation Effective April 1, 2005, following the reorganization, CAE began reporting financial results on a newly segmented basis - distinguishing between products and services -- to reflect the way that the business is now being managed. In addition to be able to more effectively manage the business, it also enables investors to evaluate performance and make informed decisions about the Company. "We listened carefully to what investors told us regarding the need for more disclosure and a clearer picture of our business," Mr. Brown stated, "and we are delivering on our commitment to communicate more effectively." CAE's financial results are now segmented as follows: 1. Simulation Products/Civil 2. Simulation Products/Military 3. Training & Services/Civil 4. Training & Services/Military Business Segment Highlights Simulation Products/Civil During the first quarter of fiscal 2006, Simulation Products/Civil won six orders for full-flight simulators, four of which were announced. At June 30, 2005, the segment's backlog had reached $277 million. Simulation Products/Civil backlog generated segment operating income of $7.1 million in the first quarter, compared to $11.0 million in the first quarter of the prior year, and a loss of $2.5 million in the fourth quarter. The segment's operating income was 35% lower than the first quarter last year because of the recognition in the latter quarter of additional investment tax credits (ITC) related to fiscal years 2000 to 2004. Excluding the additional ITC benefit, segment operating income for the first quarter of fiscal 2006 would actually have been $5.9 million higher than in the corresponding quarter last year. First-quarter revenues of $60.2 million were 28% higher than in the prior year, and 11% higher than the fourth quarter. Performance benefited from higher order intake and by successfully reaching important milestones on certain programs. While these developments are positive, the Company's Simulation Products/Civil backlog is expected to deliver lower margins over the next several quarters. Simulation Products/Military Simulation Products/Military concluded the quarter with $105.7 million in new order bookings. The segment's backlog at June 30 reached $535 million, up from $511 million at the end of the fourth quarter. The segment's operating income for the first quarter amounted to $4.8 million, and included a non-recurring charge of $1.5 million related to the writedown of deferred bid costs (incurred post-selection). Excluding non- recurring items, the segment's operating income increased by $6.7 million over the first quarter last year, and decreased by $2.5 million from the fourth quarter. The decline from the fourth quarter is the result of lower revenue volume, and differences in the mix of programs as well as their advancement in the quarter. Simulation Products / Military revenues amounted to $72.7 million and were 30% higher than the first quarter last year, owing primarily to the NH90 program. Revenues declined by 10% from the fourth quarter, due mainly to delays on certain programs. Training & Services/Civil Training & Services/Civil concluded the quarter with new agreements for a combined value of $80 million. At June 30, the segment's backlog reached $832 million, up from $830 million at the end of the fourth quarter. The segment's operating income for the first quarter amounted to $16.9 million, representing a 63% and a 27% increase over the first and fourth quarters last year. Training & Services / Civil operates within a mainly fixed cost structure and incremental revenue above a certain level provides significant leverage to profitability. The segment's operating income was favourably impacted by a 2% increase in revenue per simulator, combined with a 4% reduction in costs per simulator compared to the prior year. In addition, profitability was enhanced by a $2.3 million reduction in amortization expenses following the asset impairment effected last fiscal year. Revenues amounted to $83.8 million, 5% and 6% higher than the first and fourth quarters last year. More specifically, revenues from "wet" training increased by 10% in the first quarter. Two additional simulators became active in CAE's training network, contributing to higher sequential revenues. The first quarter is usually seasonally strong as flight crews train in preparation for the subsequent busy summer travel period. Demand was comparatively robust in the first quarter this year compared to last year, which is commensurate with the general increase in demand for air travel. Training & Services/Military Training & Services/Military concluded the quarter with $88 million in new order bookings, a significant increase over the $23 million booked in the prior quarter. The segment's backlog at June 30 reached $904 million. The segment's operating income for the first quarter amounted to $2.0 million, 67% and 52% lower than first and fourth quarters last year. Both decreases are attributable to the writedown of post-selection costs. Without the impact of this non-recurring item, the segment's operating income would have been $6.4 million, or 5% and 52% higher than the first and fourth quarters last year. The underlying increases in profitability are the result of efficiency gains on certain services programs. Revenues for the first quarter amounted to $49.3 million, which were similar to the first and fourth quarters last year. Cash flow and financial position CAE's free cash flow, defined as net cash provided by continuing operations less capital expenditures including capitalized costs, and dividends paid, plus sale and leaseback proceeds, was -$2.1 million for the quarter, compared to -$50.3 million in the prior year period. Net cash provided by continuing operating activities totalled $21.8 million compared to $3.7 million the prior year period. CAE's net debt, defined as long-term debt less cash and cash equivalents, was $282.3 million on June 30, keeping the Company well within its new borrowing covenants. After the quarter end, CAE concluded an agreement for a new, committed five-year revolving credit facility of US$400 million and Euro 100 million, which replaced its facility due to expire in April 2006. The new facility has comparable terms and conditions to the former, maintains CAE's borrowing flexibility and recognizes the Company's normal use of operating lease and project financings. Additional consolidated financial results First-quarter consolidated earnings before interest and taxes (EBIT) from continuing operations, reached $35.9 million or 13.5% of revenues, compared to $31.5 million or 13.6% of revenues, in the first quarter last year and a loss of $0.7 million in the fourth quarter. The consolidated backlog from continuing operations at June 30 remained stable at $2.5 billion. Capital expenditures for the quarter amounted to $21.5 million compared to $46.8 million in first quarter last year. Capital expenditures are expected to remain in the range of $135 million in fiscal year 2006. Non-recurring items Excluding non-recurring items, earnings per share from continuing operations for the first quarter were $0.08 which on the same basis compares to $0.04 in the first quarter last year. Reported first-quarter results include an after-tax writedown of $5.1 million in post-selection project costs related mainly to the change in procurement approach of the British Army's Armoured Vehicle Training Service (AVTS) program. Restructuring charges of $0.7 million after tax were incurred during the quarter and while significant amounts remain under the restructuring exercise, such expenses can only be recognized as they are incurred. A foreign-exchange gain of $6.7 million after tax was triggered in the quarter, following a reduction in the Company's investment in some of its self-sustaining subsidiaries. The first quarter of the previous fiscal year benefited from the recognition of $10.1 million after tax from additional ITCs related to previous years. A more detailed discussion of business segment highlights, re-segmented historical performance and summary of non-recurring items can be found in the Management Discussion & Analysis posted on CAE's website at http://www.cae.com/financialsQ1 . Investor Conference and Webcast CAE will host a conference today at 1:00 p.m. EDT for analysts, institutional investors and the media. North American participants can listen to the conference by dialling 1-800-387-6216 or 514-861-6560. Overseas participants can dial +800-7664-7664 or 1-514-861-6560. The conference and accompanying slide presentation will also be Webcast live for the public at http://www.cae.com/ . CAE is a leading provider of simulation and modelling technologies as well as integrated training services for commercial and business aviation, and defence customers worldwide. The Company has annual revenues of approximately C$1 billion, with operations and training facilities in 17 countries on five continents. Certain statements made in this news release, including, but not limited to, statements that are not historical facts, are forward-looking and are subject to important risks, uncertainties and assumptions. The results or events predicted in these forward- looking statements may differ materially from actual results or events. These statements do not reflect the potential impact of any non-recurring or other special items or of any dispositions, monetizations, mergers, acquisitions, other business combinations or other transactions that may be announced or that may occur after the date hereof. For a description of risks that could cause actual results or events to differ materially from current expectations, please refer to the section entitled "Risk Factors" in CAE Inc.'s Annual Information Form for the year ended March 31, 2005 filed with the Canadian securities commissions (available at http://www.cae.com/ or on SEDAR at http://www.sedar.com/) and with the U.S. Securities and Exchange Commission under Form 40-F (available on EDGAR at http://www.sec.gov/), as updated in CAE's fiscal 2006 First Quarter MD&A dated August 11, 2005, under the section entitled "Business Risks And Uncertainties". The forward-looking statements contained in this news release represent our expectations as of August 11, 2005 and, accordingly, are subject to change after such date. However, we disclaim any intention or obligation to update any forward-looking statements, whether as a result of new information or otherwise. > DATASOURCE: CAE INC. CONTACT: On the Web: http://www.cae.com/; Media contacts: Nathalie Bourque, Vice President, Global Communications, (514) 734-5788, ; Anne von Finckenstein, Manager, Public Relations, (514) 340-5370, ; Investor relations: Andrew Arnovitz, Director, Investor Relations, (514) 734-5760,

Copyright

1 Year Capital Gearing Chart

1 Year Capital Gearing Chart

1 Month Capital Gearing Chart

1 Month Capital Gearing Chart