
We could not find any results for:
Make sure your spelling is correct or try broadening your search.
| Share Name | Share Symbol | Market | Type |
|---|---|---|---|
| Adient plc | NYSE:ADNT | NYSE | Common Stock |
| Price Change | % Change | Share Price | High Price | Low Price | Open Price | Shares Traded | Last Trade | |
|---|---|---|---|---|---|---|---|---|
| -0.52 | -1.75% | 29.12 | 29.52 | 29.04 | 29.47 | 935,061 | 22:30:00 |
| (State or Other Jurisdiction of Incorporation) | (Commission File Number) | (IRS Employer Identification Number) | ||||||
| (Address of principal executive offices) | ||
| Title of class | Trading symbol(s) | Name of exchange on which registered | ||||||||||||
| EXHIBIT INDEX | ||||||||
| Exhibit No. | Exhibit Description | |||||||
| 99.1 | ||||||||
| 104 | Cover Page Interactive Data File (the Cover Page Interactive Data File is embedded within the Inline XBRL document). | |||||||
| ADIENT PLC | ||||||||
| Date: November 8, 2023 | By: | /s/ Heather M. Tiltmann | ||||||
| Name: | Heather M. Tiltmann | |||||||
| Title: | Executive Vice President, Chief Legal and Human Resources Officer, and Corporate Secretary | |||||||
| Three Months Ended September 30, | Twelve Months Ended September 30, | |||||||||||||||||||||||||
| (in millions, except per share data) | 2023 | 2022 | 2023 | 2022 | ||||||||||||||||||||||
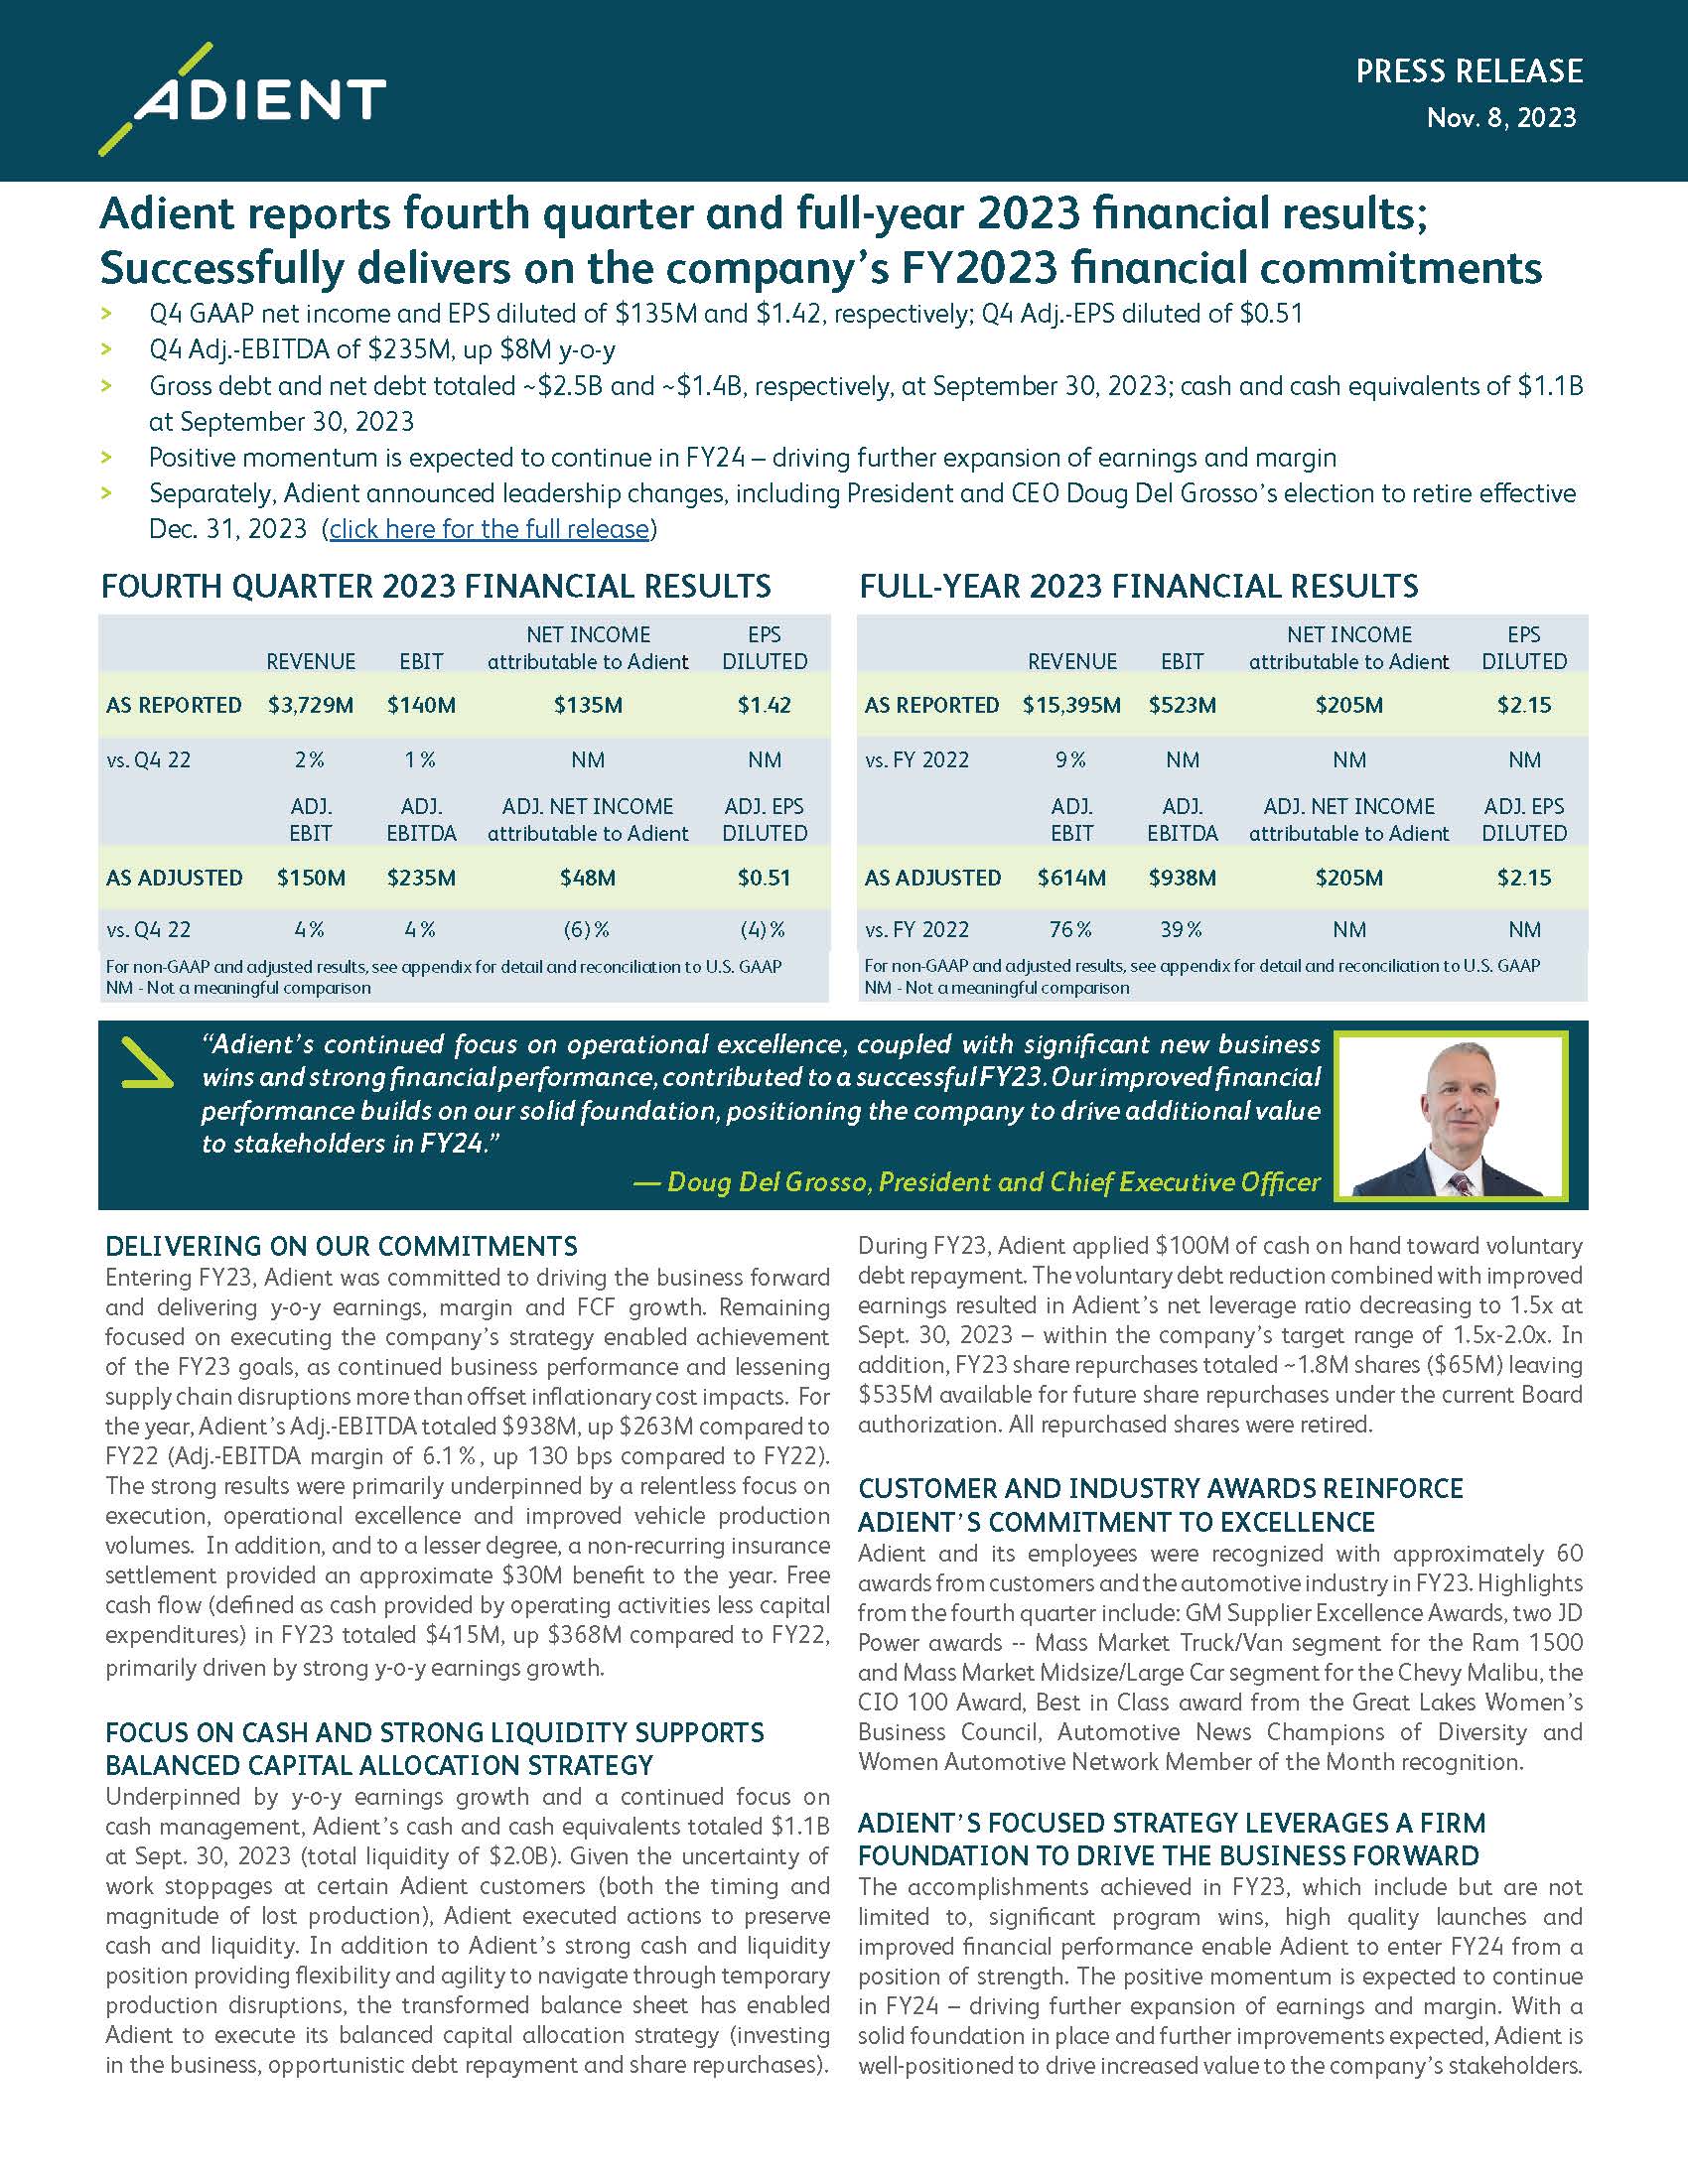
| Net sales | $ | 3,729 | $ | 3,650 | $ | 15,395 | $ | 14,121 | ||||||||||||||||||
| Cost of sales | 3,479 | 3,367 | 14,362 | 13,314 | ||||||||||||||||||||||
| Gross profit | 250 | 283 | 1,033 | 807 | ||||||||||||||||||||||
| Selling, general and administrative expenses | 127 | 159 | 554 | 598 | ||||||||||||||||||||||
| Restructuring and impairment costs | 10 | 5 | 40 | 25 | ||||||||||||||||||||||
| Equity income (loss) | 27 | 19 | 84 | 75 | ||||||||||||||||||||||
| Earnings (loss) before interest and income taxes | 140 | 138 | 523 | 259 | ||||||||||||||||||||||
| Net financing charges | 46 | 43 | 195 | 215 | ||||||||||||||||||||||
| Other pension expense (income) | 21 | (4) | 33 | (10) | ||||||||||||||||||||||
| Income (loss) before income taxes | 73 | 99 | 295 | 54 | ||||||||||||||||||||||
| Income tax provision (benefit) | (84) | 29 | — | 94 | ||||||||||||||||||||||
| Net income (loss) | 157 | 70 | 295 | (40) | ||||||||||||||||||||||
| Income attributable to noncontrolling interests | 22 | 25 | 90 | 80 | ||||||||||||||||||||||
| Net income (loss) attributable to Adient | $ | 135 | $ | 45 | $ | 205 | $ | (120) | ||||||||||||||||||
| Diluted earnings (loss) per share | $ | 1.42 | $ | 0.47 | $ | 2.15 | $ | (1.27) | ||||||||||||||||||
| Shares outstanding at period end | 93.7 | 94.9 | 93.7 | 94.9 | ||||||||||||||||||||||
| Diluted weighted average shares | 94.8 | 96.0 | 95.4 | 94.8 | ||||||||||||||||||||||
| September 30, | ||||||||||||||
| (in millions) | 2023 | 2022 | ||||||||||||
| Assets | ||||||||||||||
| Cash and cash equivalents | $ | 1,110 | $ | 947 | ||||||||||
Accounts receivable - net | 1,874 | 1,852 | ||||||||||||
| Inventories | 841 | 953 | ||||||||||||
| Other current assets | 491 | 411 | ||||||||||||
| Current assets | 4,316 | 4,163 | ||||||||||||
| Property, plant and equipment - net | 1,382 | 1,377 | ||||||||||||
| Goodwill | 2,094 | 2,057 | ||||||||||||
| Other intangible assets - net | 408 | 467 | ||||||||||||
| Investments in partially-owned affiliates | 303 | 286 | ||||||||||||
| Assets held for sale | 7 | 11 | ||||||||||||
| Other noncurrent assets | 914 | 797 | ||||||||||||
| Total assets | $ | 9,424 | $ | 9,158 | ||||||||||
| Liabilities and Shareholders' Equity | ||||||||||||||
| Short-term debt | $ | 134 | $ | 14 | ||||||||||
| Accounts payable and accrued expenses | 2,926 | 2,818 | ||||||||||||
| Other current liabilities | 678 | 669 | ||||||||||||
| Current liabilities | 3,738 | 3,501 | ||||||||||||
| Long-term debt | 2,401 | 2,564 | ||||||||||||
| Other noncurrent liabilities | 682 | 673 | ||||||||||||
| Redeemable noncontrolling interests | 57 | 45 | ||||||||||||
| Shareholders' equity attributable to Adient | 2,228 | 2,073 | ||||||||||||
| Noncontrolling interests | 318 | 302 | ||||||||||||
| Total liabilities and shareholders' equity | $ | 9,424 | $ | 9,158 | ||||||||||
| Three Months Ended September 30, | Twelve Months Ended September 30, | ||||||||||||||||||||||
| (in millions) | 2023 | 2022 | 2023 | 2022 | |||||||||||||||||||
| Operating Activities | |||||||||||||||||||||||
| Net income (loss) attributable to Adient | $ | 135 | $ | 45 | $ | 205 | $ | (120) | |||||||||||||||
| Income attributable to noncontrolling interests | 22 | 25 | 90 | 80 | |||||||||||||||||||
| Net income (loss) | 157 | 70 | 295 | (40) | |||||||||||||||||||
| Adjustments to reconcile net income (loss) to cash provided (used) by operating activities: | |||||||||||||||||||||||
| Depreciation | 76 | 75 | 290 | 298 | |||||||||||||||||||
| Amortization of intangibles | 12 | 12 | 50 | 52 | |||||||||||||||||||
| Pension and postretirement benefit expense (benefit) | 22 | (1) | 38 | (2) | |||||||||||||||||||
| Pension and postretirement contributions, net | (6) | 1 | (17) | (16) | |||||||||||||||||||
| Equity in earnings of partially-owned affiliates, net of dividends received | (7) | 42 | (34) | 4 | |||||||||||||||||||
| (Gain) on sale / impairment of nonconsolidated partially owned affiliate | — | 2 | 6 | 10 | |||||||||||||||||||
| Premium paid on repurchase of debt | — | 4 | 7 | 38 | |||||||||||||||||||
| Retrospective recoveries of Brazil indirect tax credits | — | (29) | — | (29) | |||||||||||||||||||
| Derivative loss on China Transactions | — | — | — | 3 | |||||||||||||||||||
| Deferred income taxes | (122) | — | (124) | 5 | |||||||||||||||||||
| Non-cash restructuring and impairment charges | — | 2 | — | 14 | |||||||||||||||||||
| Equity-based compensation | 9 | 8 | 34 | 29 | |||||||||||||||||||
| Other | (7) | 3 | (4) | 17 | |||||||||||||||||||
| Changes in assets and liabilities: | |||||||||||||||||||||||
| Receivables | 186 | (161) | 16 | (576) | |||||||||||||||||||
| Inventories | 6 | (36) | 126 | (62) | |||||||||||||||||||
| Other assets | 58 | (30) | (26) | 32 | |||||||||||||||||||
| Restructuring reserves | (8) | (8) | (53) | (57) | |||||||||||||||||||
| Accounts payable and accrued liabilities | (99) | 259 | 34 | 542 | |||||||||||||||||||
| Accrued income taxes | 17 | 23 | 29 | 12 | |||||||||||||||||||
| Cash provided (used) by operating activities | 294 | 236 | 667 | 274 | |||||||||||||||||||
| Investing Activities | |||||||||||||||||||||||
| Capital expenditures | (75) | (57) | (252) | (227) | |||||||||||||||||||
| Sale of property, plant and equipment | 10 | 2 | 26 | 20 | |||||||||||||||||||
| Settlement of derivatives | — | — | — | (30) | |||||||||||||||||||
| Acquisition of businesses, net of cash acquired | — | — | (6) | (19) | |||||||||||||||||||
| Business divestitures | — | — | 5 | 740 | |||||||||||||||||||
| Other | — | — | (2) | — | |||||||||||||||||||
| Cash provided (used) by investing activities | (65) | (55) | (229) | 484 | |||||||||||||||||||
| Financing Activities | |||||||||||||||||||||||
| Increase (decrease) in short-term debt | 1 | (6) | (1) | (14) | |||||||||||||||||||
| Increase (decrease) in long-term debt | — | — | 1,002 | — | |||||||||||||||||||
| Repayment of long-term debt | — | (99) | (1,104) | (987) | |||||||||||||||||||
| Debt financing costs | — | — | (23) | (1) | |||||||||||||||||||
| Share repurchases | — | — | (65) | — | |||||||||||||||||||
| Cash paid to acquire a noncontrolling interest | — | — | — | (153) | |||||||||||||||||||
| Dividends paid to noncontrolling interests | (10) | (4) | (67) | (106) | |||||||||||||||||||
| Other | (1) | — | (13) | (12) | |||||||||||||||||||
| Cash provided (used) by financing activities | (10) | (109) | (271) | (1,273) | |||||||||||||||||||
| Effect of exchange rate changes on cash and cash equivalents | (17) | (17) | (4) | (59) | |||||||||||||||||||
| Increase (decrease) in cash and cash equivalents | $ | 202 | $ | 55 | $ | 163 | $ | (574) | |||||||||||||||
| Three Months Ended September 30, | Twelve Months Ended September 30, | |||||||||||||||||||||||||
| (in millions) | 2023 | 2022 | 2023 | 2022 | ||||||||||||||||||||||
| Net Sales | ||||||||||||||||||||||||||
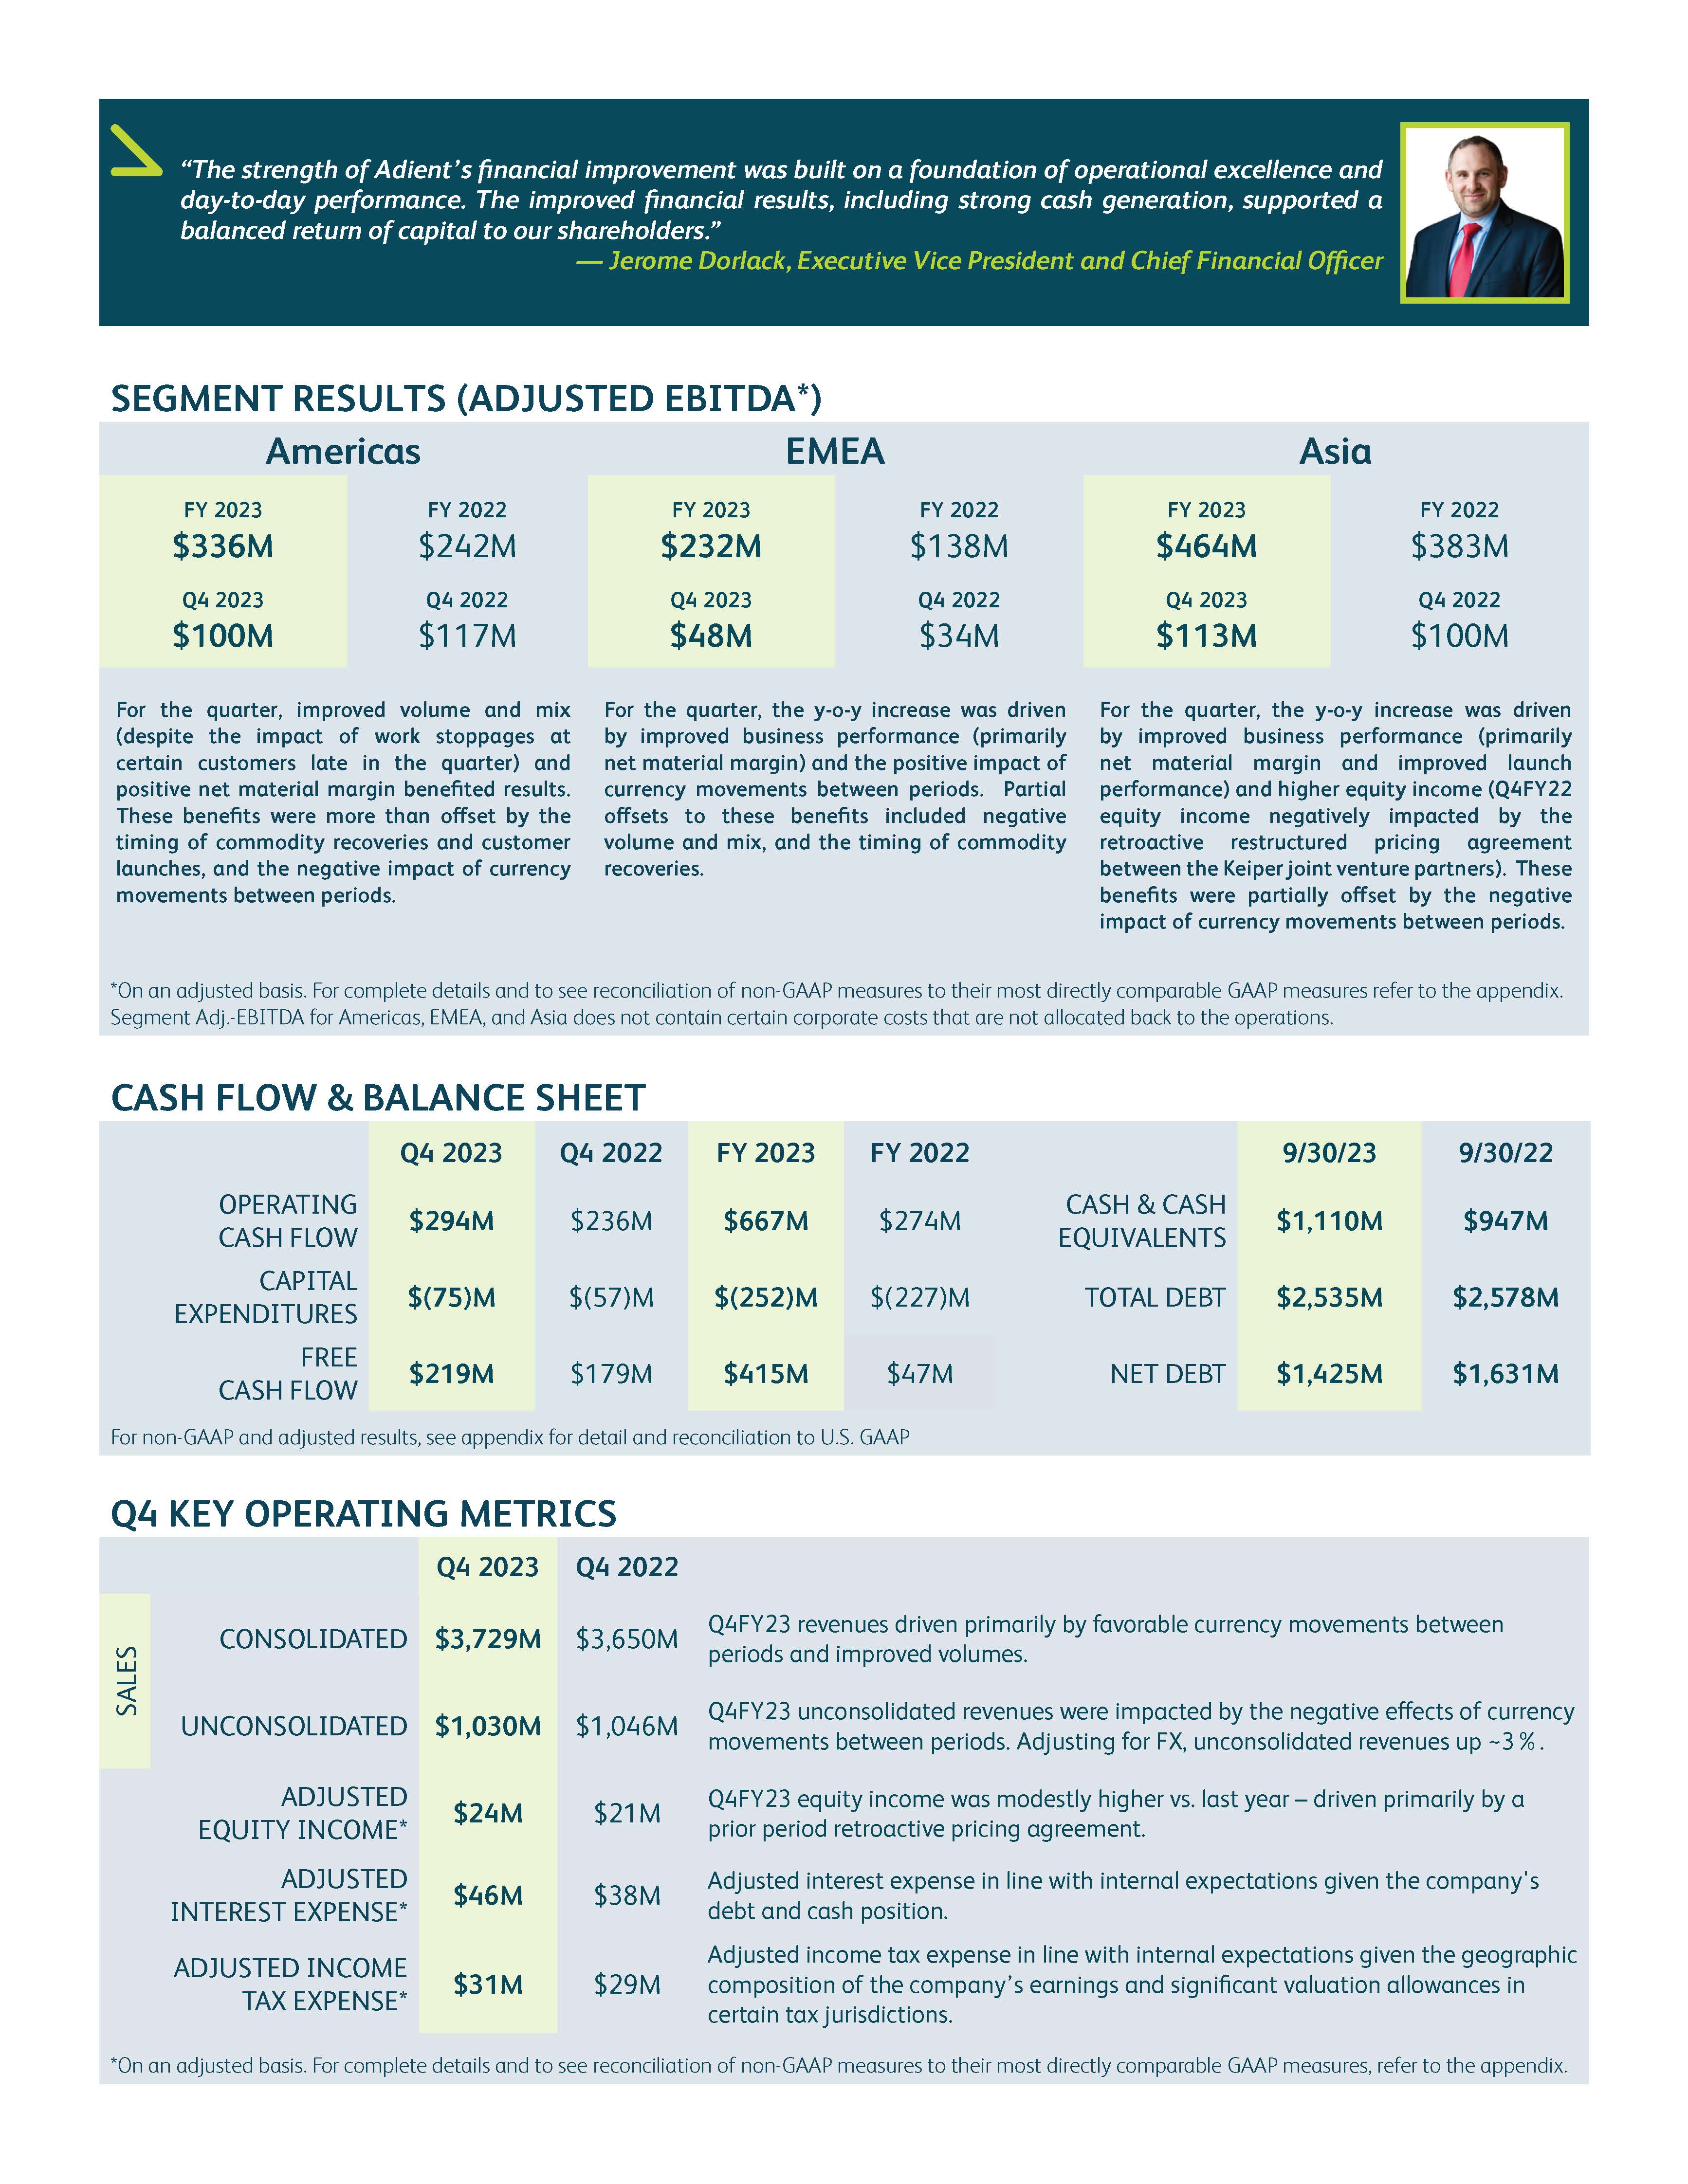
| Americas | $ | 1,835 | $ | 1,790 | $ | 7,220 | $ | 6,557 | ||||||||||||||||||
| EMEA | 1,174 | 1,101 | 5,195 | 4,764 | ||||||||||||||||||||||
| Asia | 748 | 792 | 3,085 | 2,926 | ||||||||||||||||||||||
| Eliminations | (28) | (33) | (105) | (126) | ||||||||||||||||||||||
| Total net sales | $ | 3,729 | $ | 3,650 | $ | 15,395 | $ | 14,121 | ||||||||||||||||||
| Three Months Ended September 30, | Twelve Months Ended September 30, | |||||||||||||||||||||||||
| (in millions) | 2023 | 2022 | 2023 | 2022 | ||||||||||||||||||||||
| Adjusted EBITDA | ||||||||||||||||||||||||||
| Americas | $ | 100 | $ | 117 | $ | 336 | $ | 242 | ||||||||||||||||||
| EMEA | 48 | 34 | 232 | 138 | ||||||||||||||||||||||
| Asia | 113 | 100 | 464 | 383 | ||||||||||||||||||||||
Corporate-related costs (1) | (26) | (24) | (94) | (88) | ||||||||||||||||||||||
Restructuring and impairment costs (2) | (10) | (5) | (40) | (25) | ||||||||||||||||||||||
Purchase accounting amortization (3) | (13) | (13) | (52) | (54) | ||||||||||||||||||||||
Restructuring related activities (4) | 8 | (1) | 2 | (6) | ||||||||||||||||||||||
| Stock based compensation | (9) | (8) | (34) | (29) | ||||||||||||||||||||||
| Depreciation | (76) | (75) | (290) | (298) | ||||||||||||||||||||||
Other items (5) | 5 | 13 | (1) | (4) | ||||||||||||||||||||||
| Earnings (loss) before interest and income taxes | 140 | 138 | 523 | 259 | ||||||||||||||||||||||
| Net financing charges | (46) | (43) | (195) | (215) | ||||||||||||||||||||||
| Other pension income (expense) | (21) | 4 | (33) | 10 | ||||||||||||||||||||||
| Income (loss) before income taxes | $ | 73 | $ | 99 | $ | 295 | $ | 54 | ||||||||||||||||||
| Three Months Ended September 30, | Twelve Months Ended September 30, | |||||||||||||||||||||||||
| (in millions, except per share data) | 2023 | 2022 | 2023 | 2022 | ||||||||||||||||||||||
| Income available to shareholders | ||||||||||||||||||||||||||
| Net income (loss) attributable to Adient | $ | 135 | $ | 45 | $ | 205 | $ | (120) | ||||||||||||||||||
| Weighted average shares outstanding | ||||||||||||||||||||||||||
| Basic weighted average shares outstanding | 93.7 | 94.8 | 94.5 | 94.8 | ||||||||||||||||||||||
| Effect of dilutive securities: | ||||||||||||||||||||||||||
| Stock options, unvested restricted stock and unvested performance share awards | 1.1 | 1.2 | 0.9 | — | ||||||||||||||||||||||
| Diluted weighted average shares outstanding | 94.8 | 96.0 | 95.4 | 94.8 | ||||||||||||||||||||||
| • | Adjusted EBIT is defined as income before income taxes and noncontrolling interests excluding net financing charges, restructuring, impairment and related costs, purchase accounting amortization, transaction gains/losses, other significant non-recurring items, and net mark-to-market adjustments on pension and postretirement plans. Adjusted EBIT margin is adjusted EBIT as a percentage of net sales. | ||||
| • | Adjusted EBITDA is defined as adjusted EBIT excluding depreciation and stock based compensation. Certain corporate-related costs are not allocated to the business segments in determining Adjusted EBITDA. Adjusted EBITDA margin is adjusted EBITDA as a percentage of net sales. Adjusted EBITDA excluding adjusted equity income, each as defined herein, is also presented. | ||||
| • | Adjusted net income attributable to Adient is defined as net income attributable to Adient excluding restructuring, impairment and related costs, purchase accounting amortization, transaction gains/losses, expenses associated with becoming an independent company, other significant non-recurring items, net mark-to-market adjustments on pension and postretirement plans, the tax impact of these items and other discrete tax charges/benefits. | ||||
| • | Adjusted effective tax rate is defined as adjusted income tax provision as a percentage of adjusted income before income taxes. | ||||
| • | Adjusted earnings per share is defined as Adjusted net income attributable to Adient divided by diluted weighted average shares. | ||||
| • | Adjusted equity income is defined as equity income excluding amortization of Adient's intangible assets related to its non-consolidated joint ventures and other unusual or one-time items impacting equity income. | ||||
| • | Adjusted interest expense is defined as net financing charges excluding unusual or one-time items impacting interest expense. | ||||
| • | Free cash flow is defined as cash provided by operating activities less capital expenditures. | ||||
| • | Net debt is calculated as gross debt (short-term and long-term) less cash and cash equivalents. | ||||
| • | Net leverage ratio is calculated as net debt divided by LTM Adjusted EBITDA | ||||
| Three Months Ended September 30, | ||||||||||||||||||||||||||||||||||||||
| 2023 | 2022 | |||||||||||||||||||||||||||||||||||||
| (in millions, except per share data) | GAAP Results | Adj. | Adjusted Results | GAAP Results | Adj. | Adjusted Results | ||||||||||||||||||||||||||||||||
| Net sales | $ | 3,729 | $ | — | $ | 3,729 | $ | 3,650 | $ | — | $ | 3,650 | ||||||||||||||||||||||||||
Cost of sales (6) | 3,479 | — | 3,479 | 3,367 | 29 | 3,396 | ||||||||||||||||||||||||||||||||
| Gross profit | 250 | — | 250 | 283 | (29) | 254 | ||||||||||||||||||||||||||||||||
Selling, general and administrative expenses (7) | 127 | (3) | 124 | 159 | (28) | 131 | ||||||||||||||||||||||||||||||||
Restructuring and impairment costs (2) | 10 | (10) | — | 5 | (5) | — | ||||||||||||||||||||||||||||||||
Equity income (loss) (8) | 27 | (3) | 24 | 19 | 2 | 21 | ||||||||||||||||||||||||||||||||
| Earnings (loss) before interest and income taxes (EBIT) | 140 | 10 | 150 | 138 | 6 | 144 | ||||||||||||||||||||||||||||||||
| Memo accounts: | ||||||||||||||||||||||||||||||||||||||
| Depreciation | 76 | 75 | ||||||||||||||||||||||||||||||||||||
| Equity based compensation costs | 9 | 8 | ||||||||||||||||||||||||||||||||||||
| Adjusted EBITDA | $ | 235 | $ | 227 | ||||||||||||||||||||||||||||||||||
Net financing charges (9) | 46 | — | 46 | 43 | (5) | 38 | ||||||||||||||||||||||||||||||||
Other pension expense (income) (10) | 21 | (19) | 2 | (4) | 3 | (1) | ||||||||||||||||||||||||||||||||
| Income (loss) before income taxes | 73 | 29 | 102 | 99 | 8 | 107 | ||||||||||||||||||||||||||||||||
Income tax provision (benefit) (11) | (84) | 115 | 31 | 29 | — | 29 | ||||||||||||||||||||||||||||||||
| Net income (loss) attributable to Adient | 135 | (87) | 48 | 45 | 6 | 51 | ||||||||||||||||||||||||||||||||
| Diluted earnings (loss) per share | 1.42 | (0.91) | 0.51 | 0.47 | 0.06 | 0.53 | ||||||||||||||||||||||||||||||||
| Diluted weighted average shares | 94.8 | — | 94.8 | 96.0 | — | 96.0 | ||||||||||||||||||||||||||||||||
| Twelve Months Ended September 30, | ||||||||||||||||||||||||||||||||||||||
| 2023 | 2022 | |||||||||||||||||||||||||||||||||||||
| (in millions, except per share data) | GAAP Results | Adj. | Adjusted Results | GAAP Results | Adj. | Adjusted Results | ||||||||||||||||||||||||||||||||
| Net sales | $ | 15,395 | $ | — | $ | 15,395 | $ | 14,121 | $ | — | $ | 14,121 | ||||||||||||||||||||||||||
Cost of sales (6) | 14,362 | (2) | 14,360 | 13,314 | 26 | 13,340 | ||||||||||||||||||||||||||||||||
| Gross profit | 1,033 | 2 | 1,035 | 807 | (26) | 781 | ||||||||||||||||||||||||||||||||
Selling, general and administrative expenses (7) | 554 | (43) | 511 | 598 | (77) | 521 | ||||||||||||||||||||||||||||||||
Restructuring and impairment costs (2) | 40 | (40) | — | 25 | (25) | — | ||||||||||||||||||||||||||||||||
Equity income (loss) (8) | 84 | 6 | 90 | 75 | 13 | 88 | ||||||||||||||||||||||||||||||||
| Earnings (loss) before interest and income taxes (EBIT) | 523 | 91 | 614 | 259 | 89 | 348 | ||||||||||||||||||||||||||||||||
| Memo accounts: | ||||||||||||||||||||||||||||||||||||||
| Depreciation | 290 | 298 | ||||||||||||||||||||||||||||||||||||
| Equity based compensation costs | 34 | 29 | ||||||||||||||||||||||||||||||||||||
| Adjusted EBITDA | $ | 938 | $ | 675 | ||||||||||||||||||||||||||||||||||
Net financing charges (9) | 195 | (11) | 184 | 215 | (52) | 163 | ||||||||||||||||||||||||||||||||
Other pension expense (income) (10) | 33 | (27) | 6 | (10) | 6 | (4) | ||||||||||||||||||||||||||||||||
| Income (loss) before income taxes | 295 | 129 | 424 | 54 | 135 | 189 | ||||||||||||||||||||||||||||||||
Income tax provision (benefit) (11) | — | 123 | 123 | 94 | (3) | 91 | ||||||||||||||||||||||||||||||||
| Net income (loss) attributable to Adient | 205 | — | 205 | (120) | 131 | 11 | ||||||||||||||||||||||||||||||||
| Diluted earnings (loss) per share | 2.15 | — | 2.15 | (1.27) | 1.38 | 0.11 | ||||||||||||||||||||||||||||||||
| Diluted weighted average shares | 95.4 | — | 95.4 | 94.8 | 1.0 | 95.8 | ||||||||||||||||||||||||||||||||
| Segment Performance: | ||||||||||||||||||||||||||||||||
| Three months ended September 30, 2023 | ||||||||||||||||||||||||||||||||
| Americas | EMEA | Asia | Corporate/Eliminations | Consolidated | ||||||||||||||||||||||||||||
| Net sales | $ | 1,835 | $ | 1,174 | $ | 748 | $ | (28) | $ | 3,729 | ||||||||||||||||||||||
| Adjusted EBITDA | $ | 100 | $ | 48 | $ | 113 | $ | (26) | $ | 235 | ||||||||||||||||||||||
| Adjusted EBITDA margin | 5.4 | % | 4.1 | % | 15.1 | % | N/A | 6.3 | % | |||||||||||||||||||||||
| Three months ended September 30, 2022 | ||||||||||||||||||||||||||||||||
| Americas | EMEA | Asia | Corporate/Eliminations | Consolidated | ||||||||||||||||||||||||||||
| Net sales | $ | 1,790 | $ | 1,101 | $ | 792 | $ | (33) | $ | 3,650 | ||||||||||||||||||||||
| Adjusted EBITDA | $ | 117 | $ | 34 | $ | 100 | $ | (24) | $ | 227 | ||||||||||||||||||||||
| Adjusted EBITDA margin | 6.5 | % | 3.1 | % | 12.6 | % | N/A | 6.2 | % | |||||||||||||||||||||||
| Twelve months ended September 30, 2023 | ||||||||||||||||||||||||||||||||
| Americas | EMEA | Asia | Corporate/Eliminations | Consolidated | ||||||||||||||||||||||||||||
| Net sales | $ | 7,220 | $ | 5,195 | $ | 3,085 | $ | (105) | $ | 15,395 | ||||||||||||||||||||||
| Adjusted EBITDA | $ | 336 | $ | 232 | $ | 464 | $ | (94) | $ | 938 | ||||||||||||||||||||||
| Adjusted EBITDA margin | 4.7 | % | 4.5 | % | 15.0 | % | N/A | 6.1 | % | |||||||||||||||||||||||
| Twelve months ended September 30, 2022 | ||||||||||||||||||||||||||||||||
| Americas | EMEA | Asia | Corporate/Eliminations | Consolidated | ||||||||||||||||||||||||||||
| Net sales | $ | 6,557 | $ | 4,764 | $ | 2,926 | $ | (126) | $ | 14,121 | ||||||||||||||||||||||
| Adjusted EBITDA | $ | 242 | $ | 138 | $ | 383 | $ | (88) | $ | 675 | ||||||||||||||||||||||
| Adjusted EBITDA margin | 3.7 | % | 2.9 | % | 13.1 | % | N/A | 4.8 | % | |||||||||||||||||||||||
| Three Months Ended September 30, | Twelve Months Ended September 30, | |||||||||||||||||||||||||
| (in millions) | 2023 | 2022 | 2023 | 2022 | ||||||||||||||||||||||
| Adjusted EBITDA | $ | 235 | $ | 227 | $ | 938 | $ | 675 | ||||||||||||||||||
| Less: Adjusted equity income | 24 | 21 | 90 | 88 | ||||||||||||||||||||||
| Adjusted EBITDA excluding adjusted equity income | $ | 211 | $ | 206 | $ | 848 | $ | 587 | ||||||||||||||||||
| % of Sales | 5.8 | % | 5.6 | % | 6.0 | % | 4.2 | % | ||||||||||||||||||
| Three Months Ended September 30, | ||||||||||||||||||||||||||||||||||||||
| 2023 | 2022 | |||||||||||||||||||||||||||||||||||||
| (in millions, except effective tax rate) | Income (loss) before income taxes | Tax impact | Effective tax rate | Income (loss) before income taxes | Tax impact | Effective tax rate | ||||||||||||||||||||||||||||||||
| As reported | $ | 73 | $ | (84) | * nm | $ | 99 | $ | 29 | 29.3% | ||||||||||||||||||||||||||||
Adjustments (11) | 29 | 115 | * nm | 8 | — | —% | ||||||||||||||||||||||||||||||||
| As adjusted | $ | 102 | $ | 31 | 30.4% | $ | 107 | $ | 29 | 27.1% | ||||||||||||||||||||||||||||
| Twelve Months Ended September 30, | ||||||||||||||||||||||||||||||||||||||
| 2023 | 2022 | |||||||||||||||||||||||||||||||||||||
| (in millions, except effective tax rate) | Income (loss) before income taxes | Tax impact | Effective tax rate | Income (loss) before income taxes | Tax impact | Effective tax rate | ||||||||||||||||||||||||||||||||
| As reported | 295 | $ | — | —% | $ | 54 | $ | 94 | * nm | |||||||||||||||||||||||||||||
Adjustments (11) | 129 | 123 | 95.3% | 135 | (3) | (2.2)% | ||||||||||||||||||||||||||||||||
| As adjusted | $ | 424 | $ | 123 | 29.0% | $ | 189 | $ | 91 | 48.1% | ||||||||||||||||||||||||||||
| Three Months Ended September 30, | Twelve Months Ended September 30, | |||||||||||||||||||||||||
| (in millions) | 2023 | 2022 | 2023 | 2022 | ||||||||||||||||||||||
| Net income (loss) attributable to Adient | $ | 135 | $ | 45 | $ | 205 | $ | (120) | ||||||||||||||||||
Restructuring and impairment costs (2) | 10 | 5 | 40 | 25 | ||||||||||||||||||||||
Purchase accounting amortization (3) | 13 | 13 | 52 | 54 | ||||||||||||||||||||||
Restructuring related activities (4) | (8) | 1 | (2) | 6 | ||||||||||||||||||||||
Pension mark-to-market and settlement (gain) loss (10) | 19 | (3) | 27 | (6) | ||||||||||||||||||||||
Write off of deferred financing charges upon repurchase of debt (9) | — | 1 | 4 | 8 | ||||||||||||||||||||||
Derivative loss on China transactions (9) | — | — | — | 3 | ||||||||||||||||||||||
Foreign exchange loss on intercompany loan in Russia (9) | — | — | — | 3 | ||||||||||||||||||||||
Premium paid on repurchase of debt (9) | — | 4 | 7 | 38 | ||||||||||||||||||||||
Other items (5) | (5) | (13) | 1 | 4 | ||||||||||||||||||||||
Impact of adjustments on noncontrolling interests (12) | (1) | (2) | (6) | (7) | ||||||||||||||||||||||
Tax impact of above adjustments and other tax items (11) | (115) | — | (123) | 3 | ||||||||||||||||||||||
| Adjusted net income (loss) attributable to Adient | $ | 48 | $ | 51 | $ | 205 | $ | 11 | ||||||||||||||||||
| Three Months Ended September 30, | Twelve Months Ended September 30, | |||||||||||||||||||||||||
| 2023 | 2022 | 2023 | 2022 | |||||||||||||||||||||||
| Diluted earnings (loss) per share as reported | $ | 1.42 | $ | 0.47 | $ | 2.15 | $ | (1.27) | ||||||||||||||||||
Restructuring and impairment costs (2) | 0.11 | 0.05 | 0.42 | 0.26 | ||||||||||||||||||||||
Purchase accounting amortization (3) | 0.14 | 0.14 | 0.55 | 0.58 | ||||||||||||||||||||||
Restructuring related activities (4) | (0.08) | 0.01 | (0.02) | 0.06 | ||||||||||||||||||||||
Pension mark-to-market and settlement gain/loss (10) | 0.20 | (0.03) | 0.28 | (0.06) | ||||||||||||||||||||||
Write off of deferred financing charges upon repurchase of debt (9) | — | 0.01 | 0.04 | 0.08 | ||||||||||||||||||||||
Derivative loss on China transactions (9) | — | — | — | 0.03 | ||||||||||||||||||||||
Foreign exchange (gain) loss on intercompany loan in Russia (9) | — | — | — | 0.03 | ||||||||||||||||||||||
Premium paid on repurchase of debt (9) | — | 0.04 | 0.07 | 0.40 | ||||||||||||||||||||||
Other items (5) | (0.05) | (0.14) | 0.01 | 0.04 | ||||||||||||||||||||||
Impact of adjustments on noncontrolling interests (12) | (0.01) | (0.02) | (0.06) | (0.07) | ||||||||||||||||||||||
Tax impact of above adjustments and other tax items (11) | (1.22) | — | (1.29) | 0.03 | ||||||||||||||||||||||
| Adjusted diluted earnings (loss) per share | $ | 0.51 | $ | 0.53 | $ | 2.15 | $ | 0.11 | ||||||||||||||||||
September 30, | ||||||||||||||
| (in millions) | 2023 | 2022 | ||||||||||||
| Cash | $ | 1,110 | $ | 947 | ||||||||||
| Total debt | 2,535 | 2,578 | ||||||||||||
| Net debt | $ | 1,425 | $ | 1,631 | ||||||||||
| LTM Adjusted EBITDA | $ | 938 | $ | 675 | ||||||||||
| Net leverage ratio | 1.52 | 2.42 | ||||||||||||
| Three Months Ended September 30, | Twelve Months Ended September 30, | |||||||||||||||||||||||||
| (in millions) | 2023 | 2022 | 2023 | 2022 | ||||||||||||||||||||||
| Operating cash flow | $ | 294 | $ | 236 | $ | 667 | $ | 274 | ||||||||||||||||||
| Capital expenditures | (75) | (57) | (252) | (227) | ||||||||||||||||||||||
| Free cash flow | $ | 219 | $ | 179 | $ | 415 | $ | 47 | ||||||||||||||||||
| FY23 | FY22 | |||||||||||||||||||||||||
| (in millions) | Q4 | YTD | Q4 | YTD | ||||||||||||||||||||||
| Adjusted EBITDA excluding adjusted equity income | $ | 211 | $ | 848 | $ | 206 | $ | 587 | ||||||||||||||||||
Dividends received from nonconsolidated partially-owned affiliates | 20 | 56 | 62 | 89 | ||||||||||||||||||||||
| Restructuring (cash) | (11) | (60) | (9) | (57) | ||||||||||||||||||||||
| Net Customer Tooling | (7) | (47) | 32 | (4) | ||||||||||||||||||||||
| Trade Working Capital (Net AR/AP + Inventory) | 58 | 37 | (15) | (21) | ||||||||||||||||||||||
| Accrued Compensation | 16 | 57 | 2 | (43) | ||||||||||||||||||||||
| Interest paid | (38) | (145) | (58) | (192) | ||||||||||||||||||||||
| Tax refund/taxes paid | (20) | (94) | (14) | (77) | ||||||||||||||||||||||
| Non-income related taxes (VAT) | 9 | 4 | — | 33 | ||||||||||||||||||||||
| Commercial settlements | 51 | 87 | 31 | (35) | ||||||||||||||||||||||
| Capitalized engineering | (8) | (33) | (4) | 29 | ||||||||||||||||||||||
| Prepaids | 32 | (9) | 22 | 15 | ||||||||||||||||||||||
| Other | (19) | (34) | (19) | (50) | ||||||||||||||||||||||
| Operating cash flow | 294 | 667 | 236 | 274 | ||||||||||||||||||||||
| Capital expenditures | (75) | (252) | (57) | (227) | ||||||||||||||||||||||
| Free cash flow | $ | 219 | $ | 415 | $ | 179 | $ | 47 | ||||||||||||||||||
| Three Months Ended September 30, | Twelve Months Ended September 30, | |||||||||||||||||||||||||
| (in millions) | 2023 | 2022 | 2023 | 2022 | ||||||||||||||||||||||
| Restructuring charges | $ | (10) | $ | (3) | $ | (40) | $ | (15) | ||||||||||||||||||
| Held for sale and other asset adjustments | — | — | — | (6) | ||||||||||||||||||||||
| Impairment charge associated with Russian operations | — | (2) | — | (4) | ||||||||||||||||||||||
| $ | (10) | $ | (5) | $ | (40) | $ | (25) | |||||||||||||||||||
| Three Months Ended September 30, | Twelve Months Ended September 30, | |||||||||||||||||||||||||
| (in millions) | 2023 | 2022 | 2023 | 2022 | ||||||||||||||||||||||
| Restructuring related charges | $ | (2) | $ | (1) | $ | (8) | $ | (6) | ||||||||||||||||||
| Gain on sale of restructured facility | 10 | — | 10 | — | ||||||||||||||||||||||
| $ | 8 | $ | (1) | $ | 2 | $ | (6) | |||||||||||||||||||
| Three Months Ended September 30, | Twelve Months Ended September 30, | |||||||||||||||||||||||||
| (in millions) | 2023 | 2022 | 2023 | 2022 | ||||||||||||||||||||||
| Transaction costs | $ | — | $ | (1) | $ | (3) | $ | (8) | ||||||||||||||||||
| Brazil indirect tax recoveries | 1 | 29 | 4 | 32 | ||||||||||||||||||||||
| Non-recurring contract related settlement | — | (14) | — | (14) | ||||||||||||||||||||||
| One-time divestiture gain at an affiliate | 4 | — | 4 | — | ||||||||||||||||||||||
Loss on sale / impairment of nonconsolidated partially-owned affiliates | — | (1) | (6) | (10) | ||||||||||||||||||||||
| Other | — | — | — | (4) | ||||||||||||||||||||||
| $ | 5 | $ | 13 | $ | (1) | $ | (4) | |||||||||||||||||||
| Three Months Ended September 30, | Twelve Months Ended September 30, | |||||||||||||||||||||||||
| (in millions) | 2023 | 2022 | 2023 | 2022 | ||||||||||||||||||||||
| Purchase accounting amortization | $ | — | $ | — | $ | (1) | $ | (1) | ||||||||||||||||||
| Restructuring related charges | (1) | — | (5) | (4) | ||||||||||||||||||||||
| Brazil indirect tax recoveries | 1 | 29 | 4 | 32 | ||||||||||||||||||||||
| Other | — | — | — | (1) | ||||||||||||||||||||||
| $ | — | $ | 29 | $ | (2) | $ | 26 | |||||||||||||||||||
| Three Months Ended September 30, | Twelve Months Ended September 30, | |||||||||||||||||||||||||
| (in millions) | 2023 | 2022 | 2023 | 2022 | ||||||||||||||||||||||
| Purchase accounting amortization | $ | (12) | $ | (12) | $ | (49) | $ | (51) | ||||||||||||||||||
| Gain on sale of restructured facility | 10 | — | 10 | — | ||||||||||||||||||||||
| Restructuring related charges | (1) | (1) | (1) | (1) | ||||||||||||||||||||||
| Transaction costs | — | (1) | (3) | (8) | ||||||||||||||||||||||
| Non-recurring contract related settlement | — | (14) | — | (14) | ||||||||||||||||||||||
| Other | — | — | — | (3) | ||||||||||||||||||||||
| $ | (3) | $ | (28) | $ | (43) | $ | (77) | |||||||||||||||||||
| Three Months Ended September 30, | Twelve Months Ended September 30, | |||||||||||||||||||||||||
| (in millions) | 2023 | 2022 | 2023 | 2022 | ||||||||||||||||||||||
Purchase accounting amortization | $ | 1 | $ | 1 | $ | 2 | $ | 2 | ||||||||||||||||||
| Gain on sale of certain assets at affiliates in China | (4) | (7) | (4) | (7) | ||||||||||||||||||||||
Restructuring related charges | — | — | 2 | 1 | ||||||||||||||||||||||
(Gain) loss on sale / impairment of nonconsolidated partially-owned affiliates | — | 1 | 6 | 10 | ||||||||||||||||||||||
| Customer termination charge | — | 7 | — | 7 | ||||||||||||||||||||||
| $ | (3) | $ | 2 | $ | 6 | $ | 13 | |||||||||||||||||||
| Three Months Ended September 30, | Twelve Months Ended September 30, | |||||||||||||||||||||||||
| (in millions) | 2023 | 2022 | 2023 | 2022 | ||||||||||||||||||||||
| Premium paid on repurchase of debt | $ | — | $ | (4) | $ | (7) | $ | (38) | ||||||||||||||||||
| Write off of deferred financing charges upon repurchase of debt | — | (1) | (4) | (8) | ||||||||||||||||||||||
| Derivative loss on China transactions | — | — | — | (3) | ||||||||||||||||||||||
| Foreign exchange loss on intercompany loan in Russia | — | — | — | (3) | ||||||||||||||||||||||
| $ | — | $ | (5) | $ | (11) | $ | (52) | |||||||||||||||||||
| Three Months Ended September 30, | Twelve Months Ended September 30, | |||||||||||||||||||||||||
| (in millions) | 2023 | 2022 | 2023 | 2022 | ||||||||||||||||||||||
| Mark-to-market adjustment gain (loss) | $ | (19) | $ | 3 | $ | (19) | $ | 7 | ||||||||||||||||||
| One-time settlement and curtailment gain (loss) | — | — | (8) | (1) | ||||||||||||||||||||||
| $ | (19) | $ | 3 | $ | (27) | $ | 6 | |||||||||||||||||||
| Three Months Ended September 30, | Twelve Months Ended September 30, | |||||||||||||||||||||||||
| (in millions) | 2023 | 2022 | 2023 | 2022 | ||||||||||||||||||||||
| Tax rate change | $ | — | $ | — | $ | — | $ | 4 | ||||||||||||||||||
| Brazil indirect tax recoveries | — | (7) | — | (4) | ||||||||||||||||||||||
| Valuation allowances | 112 | 8 | 111 | (4) | ||||||||||||||||||||||
| Amortization | 1 | 1 | 6 | 7 | ||||||||||||||||||||||
| Pension mark-to-market and settlement loss | 1 | — | 3 | — | ||||||||||||||||||||||
| Other reconciling items | 1 | (2) | 3 | (6) | ||||||||||||||||||||||
| $ | 115 | $ | — | $ | 123 | $ | (3) | |||||||||||||||||||
Cover |
Nov. 08, 2023 |
|---|---|
| Entity Addresses [Line Items] | |
| Document Type | 8-K |
| Document Period End Date | Nov. 08, 2023 |
| Entity Registrant Name | ADIENT PLC |
| Entity Incorporation, State or Country Code | L2 |
| Entity File Number | 001-37757 |
| Entity Tax Identification Number | 98-1328821 |
| Entity Address, Address Line One | 3 Dublin Landings |
| Entity Address, Address Line Two | North Wall Quay |
| Entity Address, City or Town | Dublin 1 |
| Entity Address, Country | IE |
| Entity Address, Postal Zip Code | D01 H104 |
| City Area Code | 734 |
| Local Phone Number | 254-5000 |
| Title of 12(b) Security | Ordinary Shares, par value $0.001 |
| Trading Symbol | ADNT |
| Security Exchange Name | NYSE |
| Written Communications | false |
| Soliciting Material | false |
| Pre-commencement Tender Offer | false |
| Pre-commencement Issuer Tender Offer | false |
| Entity Emerging Growth Company | false |
| Entity Central Index Key | 0001670541 |
| Amendment Flag | false |
1 Year Adient Chart |
1 Month Adient Chart |

It looks like you are not logged in. Click the button below to log in and keep track of your recent history.
Support: +44 (0) 203 8794 460 | support@advfn.com
By accessing the services available at ADVFN you are agreeing to be bound by ADVFN's Terms & Conditions
 Hot Features