| Share Name | Share Symbol | Market | Type |
|---|---|---|---|
| Abbott Laboratories | NYSE:ABT | NYSE | Common Stock |
| Price Change | % Change | Share Price | High Price | Low Price | Open Price | Shares Traded | Last Trade | |
|---|---|---|---|---|---|---|---|---|
| -3.70 | -2.85% | 126.19 | 128.49 | 124.50 | 125.00 | 9,537,889 | 00:00:00 |
UNITED STATES
SECURITIES AND EXCHANGE COMMISSION
Washington, D.C. 20549
Proxy Statement Pursuant to Section 14(a) of the
Securities Exchange Act of 1934 (Amendment No. )
| ☑ | Filed by the Registrant | ☐ | Filed by a party other than the Registrant |
| CHECK THE APPROPRIATE BOX: | ||
| ☐ | Preliminary Proxy Statement | |
| ☐ | Confidential, for Use of the Commission Only (as permitted by Rule 14a-6(e)(2)) | |
| ☑ | Definitive Proxy Statement | |
| ☐ | Definitive Additional Materials | |
| ☐ | Soliciting Material under §240.14a-12 | |
(Name of Registrant as Specified In Its Charter)
(Name of Person(s) Filing Proxy
Statement, if other than the Registrant)
| PAYMENT OF FILING FEE (CHECK ALL BOXES THAT APPLY): | ||
| ☑ | No fee required | |
| ☐ | Fee paid previously with preliminary materials | |
| ☐ | Fee computed on table in exhibit required by Item 25(b) per Exchange Act Rules 14a-6(i)(1) and 0-11 | |
![]()
Abbott Laboratories
100 Abbott Park Road
Abbott Park, Illinois 60064-6400 U.S.A.
On the Cover: TRINITY LINDBLADE
WALKERSVILLE, MARYLAND, USA
FREESTYLE LIBRE 3 SYSTEM
Her mother knew early in her life that
something in
Trinity’s body wasn’t working
right. When Trinity was diagnosed with
Type 1 diabetes, it started a journey to a
better
understanding of the impact of food
and exercise on her health.
TABLE OF CONTENTS
 |
i |
NOTICE OF 2025 ANNUAL MEETING OF SHAREHOLDERS
 |
DATE AND TIME |  |
VIRTUAL MEETING SITE |  |
WHO CAN VOTE |
| Friday, April 25, 2025 at 9:00 a.m. Central Time |
meetnow.global/ABT2025 | Shareholders of record at the close of business on February 26, 2025 |
| ITEMS OF BUSINESS | Board Voting Recommendation | |||
| Item 1 | Election of the 12 director nominees named in this proxy statement to hold office until the next Annual Meeting or until the next meeting of shareholders at which directors are elected | FOR Each Director Nominee | ||
| Item 2 | Ratification of the appointment of Ernst & Young LLP as auditors of Abbott for 2025 | FOR | ||
| Item 3 | Approval, on an advisory basis, of executive compensation | FOR | ||
Shareholders will also transact such other business as may properly come before the meeting, including any adjournment or postponement thereof.
To attend the Annual Meeting, shareholders will be required to enter a control number. Please see page 84 for further instructions on how to attend the Annual Meeting.
YOUR VOTE IS IMPORTANT
Please sign and promptly return your proxy or voting instruction form in the enclosed envelope, or vote your shares by telephone or using the Internet.
If you are a registered shareholder (you received your proxy materials from Abbott through Abbott’s transfer agent, Computershare), you may vote your shares by telephone (1-800-652-VOTE (8683)) or on the Internet at www.investorvote.com/abt.
If you are a beneficial shareholder (you received your proxy materials from a broker, bank, or other agent), please refer to the voting instructions provided to you by your broker, bank, or other agent.
This proxy statement and the accompanying proxy card, and the Notice of Internet Availability of Proxy Materials, are being provided to shareholders on or about March 14, 2025.
By order of the Board of Directors.
HUBERT L. ALLEN
Secretary
March 14, 2025
Important Notice Regarding the Availability of Proxy Materials for the Shareholder Meeting to Be Held on April 25, 2025
Abbott’s 2025 Proxy Statement and 2024 Annual Report to Shareholders are available at www.abbott.com/proxy.
|
1 |
PROXY SUMMARY
This summary contains highlights about Abbott and the upcoming 2025 Annual Meeting of Shareholders. This summary does not contain all of the information that you should consider in advance of the meeting, and we encourage you to read the entire proxy statement carefully before voting.
| ABBOTT’S DIVERSIFIED BUSINESS MODEL DELIVERS LEADING SHAREHOLDER RETURNS |
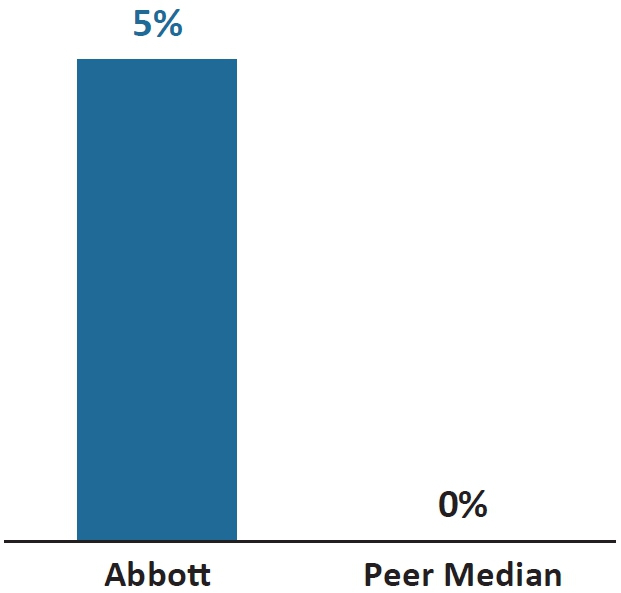
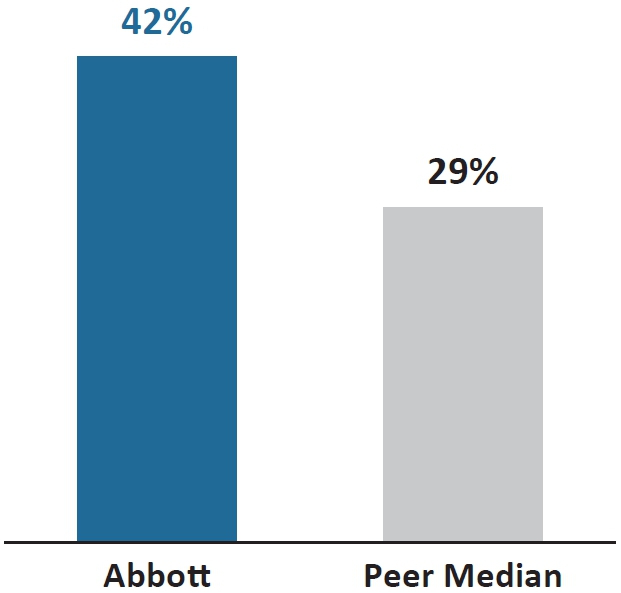
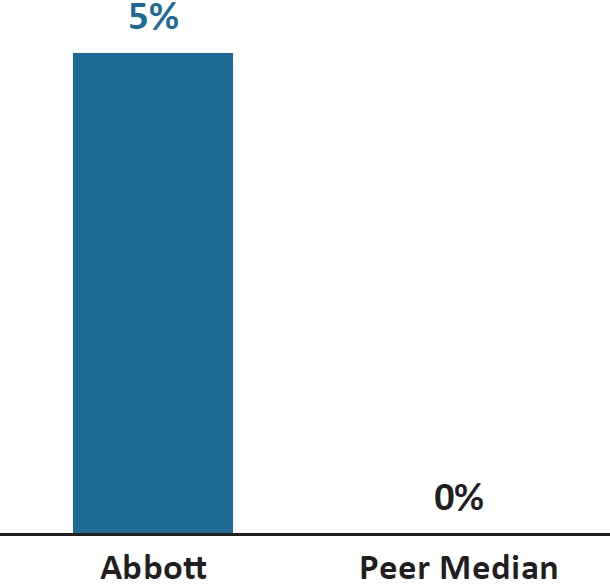
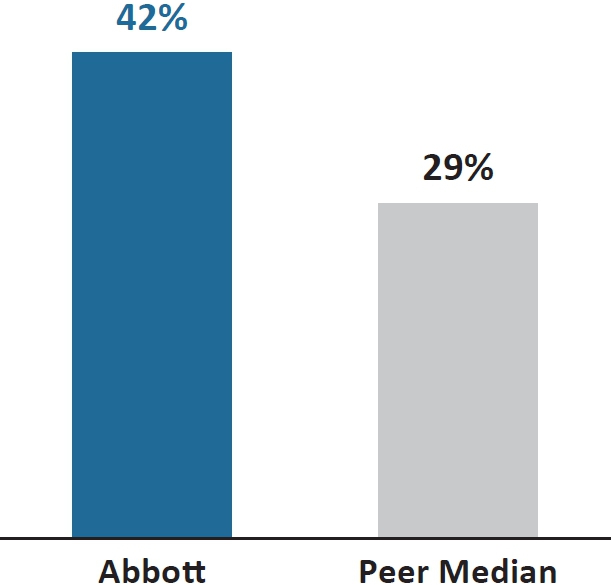
Abbott’s strong sustainable performance has resulted in total shareholder return (TSR) above the peer group median on a one-year and five-year basis.
On a one-year basis, our TSR performance placed us at the 58th percentile relative to our peers and on a five-year basis, our TSR performance placed us at the 68th percentile relative to our peers. These consistent top-tier returns are driven by strong execution, an effective governance structure, and the strength of our diversified business model with leadership positions in some of the largest and fastest-growing markets in healthcare and innovative product portfolios across our businesses.
| 1-Year Total Shareholder Return | 5-Year Total Shareholder Return | ||||
 |
 |
||||
Abbott’s three-year TSR performance reflects our significant contributions to the fight against COVID-19. During 2022, which represents the starting point for three-year TSR measurement, we delivered $8.4 billion in COVID test sales. As the COVID pandemic shifted to an endemic state, in part due to the readily available testing produced by Abbott and other companies, the demand for testing declined and negatively impacted TSR. We are proud of how our company rose to the challenge during that troubling time. Extraordinary events, such as COVID, demonstrate why an over reliance on one fixed time-frame TSR measurement does not represent a complete picture of company performance.
In addition to delivering significant shareholder returns, Abbott continued to take important steps to position the Company for long-term, sustainable growth.
| ROBUST INNOVATION PIPELINE | INVESTING FOR FUTURE GROWTH | SHAREHOLDER RETURNS | ||
| ● Steady cadence of important product approvals across our businesses that will be significant contributors to growth in the coming years. This includes first-of-its-kind technology like TriClip® and Aveir® along with our continuous glucose monitoring systems. | ● Increased manufacturing scale and capabilities across several important products. ● Invested $2.2 billion in capital projects in the past year. |
● Returned $5.1 billion to shareholders in 2024 and announced a 7.3% increase to our dividend for 2025, marking our 53rd consecutive year of dividend increases. | ||
| 2 | |
| EXECUTIVE COMPENSATION |
SHAREHOLDER ENGAGEMENT AND FEEDBACK
In 2024, we contacted shareholders representing over 60% of our outstanding shares to discuss our compensation program and various topics:
| ● | Rigorous Goal Setting: We link executive pay to performance against operating and financial plans, strategic business priorities, initiatives, and human capital metrics. |
| ● | Human Capital Management: Our robust talent management process ensures we cultivate the talent essential for today and tomorrow. We achieve this by providing exceptional development and advancement opportunities, offering unique benefits that support employees and their families, and enabling meaningful work that makes a difference. |
| ● | Peer Review Process: Grounded in good governance principles, our Compensation Committee conducts annual reviews of the peer group to ensure that Abbott remains well-positioned in terms of size, growth, return profiles, geographic breadth, and management structure. |
| ● | Board Composition and Succession Planning: Since 2018, we have added six new independent directors, including three women and three minorities, enhancing our board’s diversity and expertise. |
KEY FEATURES OF OUR EXECUTIVE COMPENSATION PROGRAM
The following practices and policies ensure alignment of interests between shareholders and management, and effective ongoing compensation governance.
| Compensation Practice | Abbott Policy | More Information On Page | |
| Compensation is Market-Based | Yes | Benchmark peers with investment profiles, operating characteristics, and employment and business markets similar to Abbott. Annual incentive plan goals are set to exceed market growth in relevant markets/business segments | 29 - 32 |
| Compensation is Performance-Based | Yes | Short-term and long-term incentive awards are 100% performance based. Annual incentive plan goals are set to exceed market growth in relevant markets and business segments | 30 - 32 |
| Double-Trigger Change in Control | Yes | Provide change in control benefits under double-trigger circumstances only | 67 - 68 |
| Recoupment Policies | Yes | Compensation Committee can seek recoupment of incentive compensation, forfeit existing awards or reduce future awards | 52 |
| Robust Share Ownership Guidelines | Yes | Require significant share ownership for officers and directors, and share retention requirements until guidelines are met | 26 and 51 |
| Capped Incentive Awards | Yes | Incentive award payments are capped | 31 and 54 |
| Independent Compensation Committee Consultant | Yes | Committee consultant performs no other work for Abbott | 21 |
| Tax Gross Ups | No | No tax gross ups under our executive officer pay program | 50 - 51 |
| Guaranteed Bonuses | No | No guaranteed bonuses | 30 - 31 |
| Employment Contracts | No | No employment contracts | 66 |
| Excessive Risk Taking | No | No highly leveraged incentive plans that encourage excessive risk taking | 53 - 54 |
| Hedging and Pledging of Company Shares | No | No hedging or pledging of Abbott shares is allowed | 52 and 54 |
| Discounted Stock Options | No | No discounted stock options are allowed or granted | 54 |
Details of the compensation decisions made for our named executive officers are outlined on pages 38 to 49.
| THE STRENGTH OF OUR COMPENSATION PROGRAM IS EVIDENT IN OUR ‘SAY ON PAY’ VOTING RESULTS. OVER THE PAST FIVE YEARS, ABBOTT AVERAGED 91% SUPPORT FROM SHAREHOLDERS. |
|
3 |
| DIRECTOR NOMINEES |
The Board of Directors recommends a vote FOR the election of each of the following nominees for director. All nominees are currently serving as directors. Additional information about each director nominee’s background and experience can be found beginning on page 9.
| Name | Principal Occupation | Age | Director
Since |
Committee
Memberships | ||||
| ROBERT J. ALPERN, M.D. Independent |
Professor and Former Dean, Yale School of Medicine | 74 | 2008 | ● Nominations and Governance ● Public Policy | ||||
| CLAIRE BABINEAUX-FONTENOT Independent |
CEO, Feeding America | 60 | 2022 | ● Audit ● Public Policy | ||||
| SALLY E. BLOUNT, PH.D. Independent |
President and CEO, Catholic Charities of the Archdiocese of Chicago, and Professor and Former Dean, J.L. Kellogg Graduate School of Management | 63 | 2011 | ● Nominations and Governance ● Public Policy | ||||
| ROBERT B. FORD | Chairman of the Board and CEO, Abbott Laboratories | 51 | 2019 | ● Executive (Chair) | ||||
| PAOLA GONZALEZ Independent |
Vice President, Global FP&A, The Clorox Company | 53 | 2021 | ● Audit ● Nominations and Governance | ||||
| MICHELLE A. KUMBIER Independent |
President, Turf & Consumer Products, Briggs & Stratton, LLC | 57 | 2018 | ● Audit ● Compensation | ||||
| DARREN W. McDEW Independent |
Retired General, U.S. Air Force, and Former Commander of U.S. Transportation Command | 64 | 2019 | ● Nominations and Governance ● Public Policy | ||||
| NANCY McKINSTRY Lead Independent Director |
CEO and Chairman of the Executive Board, Wolters Kluwer N.V. | 66 | 2011 | ● Audit (Chair) ● Compensation ● Executive | ||||
| MICHAEL G. O’GRADY Independent |
Chairman and CEO, Northern Trust Corporation | 59 | 2023 | ● Compensation ● Nominations and Governance | ||||
| MICHAEL F. ROMAN Independent |
Retired Chairman, President and CEO, 3M Company | 65 | 2021 | ● Compensation ● Public Policy (Chair) ● Executive | ||||
| DANIEL J. STARKS Independent |
Retired Chairman, President and CEO, St. Jude Medical, Inc. | 70 | 2017 | ● Compensation (Chair) ● Public Policy ● Executive | ||||
| JOHN G. STRATTON Independent |
Executive Chairman, Frontier Communications Parent, Inc. | 64 | 2017 | ● Audit ● Nominations and Governance (Chair) ● Executive |
| 4 | |
| CORPORATE GOVERNANCE |
Abbott is committed to strong corporate governance that is aligned with shareholder interests. Our Board spends significant time with Abbott’s senior management to understand the dynamics, issues, and opportunities for Abbott, and also regularly monitors leading practices in governance and adopts measures that it determines are in the best interest of Abbott and its shareholders.
BOARD GOVERNANCE HIGHLIGHTS
| ● | All directors elected annually by majority vote | |
| ● | Eleven out of twelve director nominees are independent | |
| ● | Fully independent Board Committees – Audit Committee, Compensation Committee, Nominations and Governance Committee, and Public Policy Committee | |
| ● | Lead Independent Director who is appointed by the independent directors for oversight role | |
| ● | Executive sessions of the independent directors, led by the Lead Independent Director, at each regularly scheduled Board meeting | |
| ● | Annual evaluations of the Board, each Committee, and each director, that are led by the Lead Independent Director and conducted anonymously to facilitate candid feedback | |
| ● | Review of Chairman and CEO performance and approval of compensation by independent directors and fully independent Committees | |
| ● | Strong risk oversight, with areas of focus including cybersecurity and data protection, product quality and regulatory compliance, and sustainability | |
| ● | Full Board oversight of corporate strategy and senior management succession planning | |
| ● | Private Committee sessions with members of senior management |
ROBUST BOARD ASSESSMENT AND REFRESHMENT PROCESS
| Evaluation |  |
Assessment | |
Refreshment | ||
Board regularly reviews Abbott’s governance practices, leadership structure, and Board and Committee composition All directors also conduct annual self-evaluations to assess Board, Committee, and peer performance |
Board identifies how it can further its effectiveness through a combination of new perspectives and internal improvements | To supplement the Board’s skills and provide fresh perspective, six new independent directors have been nominated since 2018, three of whom are women and three of whom are minorities | ||||
|
5 |
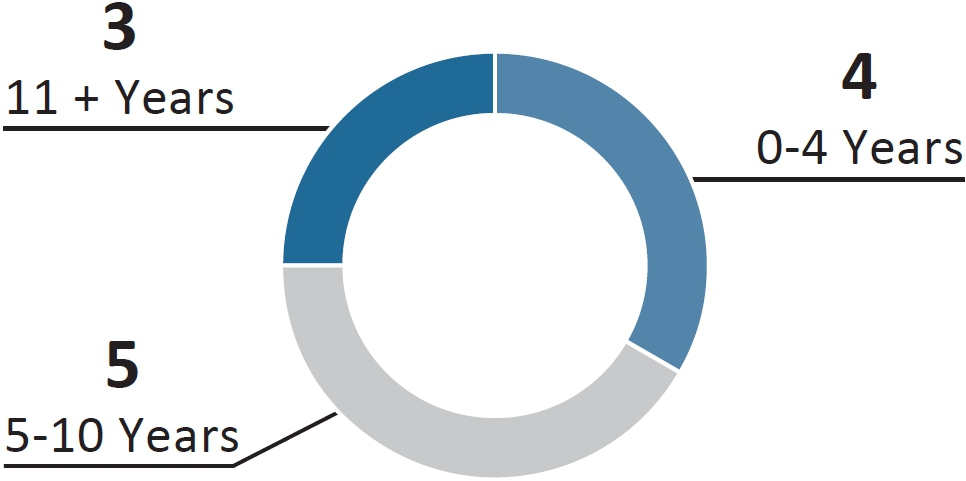
HIGHLY QUALIFIED BOARD, WITH DIVERSE BACKGROUNDS, SKILLS AND EXPERIENCES TO PROVIDE STRONG OVERSIGHT AND GUIDANCE
| THE 12 DIRECTOR NOMINEES COMPRISE A WELL-BALANCED, DIVERSE BOARD. | ||
| EXPERTISE ALIGNED WITH ABBOTT’S DIVERSIFIED OPERATING MODEL AND LONG-TERM STRATEGY | WELL-BALANCED TENURE
|
|
| Healthcare Industry | ||
| Finance and Accounting | ||
| Science, Innovation, and Technology | ||
| Risk Management, including Data Protection and Cybersecurity | ||
| Global Strategy and Operations | BOARD DIVERSITY
|
|
| Senior Leadership of Large, Complex Organizations | ||
| Government, Regulatory and Compliance | ||
| Consumer Marketing and Brand Management | ||
| Sustainability and Corporate Responsibility | ||
LEAD INDEPENDENT DIRECTOR WITH DISTINCT RESPONSIBILITIES
|
|
| 6 | |
| OUR COMMITMENT TO SUSTAINABILITY |
The Board of Directors and its committees have oversight over Abbott’s environmental, social and governance practices. The Board has regular discussions with management on the sustainability matters noted below, as well as workplace, management, and Board composition, emerging governance practices and trends, global compliance matters, and sustainability reporting. Executive compensation is linked to Sustainability commitments, as discussed in more detail on pages 35 through 37.
2030 SUSTAINABILITY PLAN
At Abbott, sustainability means managing our company to deliver long-term impact for the people we serve — shaping the future of healthcare and helping the greatest number of people live better and healthier lives. Our products and services touched the lives of approximately 2 billion people in 2023 and our goal is to reach 3 billion people a year by 2030.
To impact the most lives, we must get our innovative healthcare solutions to people who need them and ensure our business is resilient and prepared for the future, working to protect the environment, ensure a responsible supply chain, build the workforce of tomorrow and responsibly connect technology and care.
INNOVATE FOR ACCESS AND AFFORDABILITY
| Make access and affordability core to new product innovation |  |
Transform care for chronic disease, malnutrition and infectious diseases |  |
Advance health equity through partnership | |||
| Integrate access, affordability and data insights as design principles into our R&D work and portfolio. | Transform the standard of care for diabetes, cardiovascular and other chronic diseases, and deliver break-through science and technologies to improve health outcomes. Reduce preventable deaths and infectious diseases through diagnostics, treatment, and education programs. |
Expand affordable access to healthcare for underserved, diverse and at-risk communities by delivering innovative, decentralized models of care. Partner with stakeholders to improve health outcomes by advancing standards and building access to affordable, integrated solutions. | |||||
BUILD A FOUNDATION FOR THE FUTURE
 |
CLIMATE Protect a healthy environment Protect our climate and water, including supporting the Science Based Targets initiative (SBTi) objective of reducing Scope 1, 2, and 3 carbon emissions. Reduce product packaging and waste, including addressing 50 million pounds of packaging and using a circular economy approach to achieve at least 90% waste diversion rate. |
 |
OUR PEOPLE Build the diverse, innovative workforce of tomorrow Attract, retain, and develop the best talent from the more than 160 countries in which we do business. Create opportunities in Abbott’s science, technology, engineering, and math (STEM) programs and internships for more than 200,000 young people. | |
 |
SUPPLY CHAIN Ensure a resilient, diverse and responsible supply chain Certify that newly contracted direct material spends incorporate internal requirements. Ensure ethical sourcing from suppliers with high-risk sustainability factors through 100% auditing. Increase diversity of supply chain to mitigate single source and supply shocks. |
 |
DATA AND DATA PRIVACY Responsibly connect data, technology, and care Be a trusted healthcare leader in secure and responsible data collection, use, management and privacy, in order to protect our patients and customers, empower them to make better, more complete decisions about their health, and drive innovation through insights and analytics. |
|
7 |
| VOTING MATTERS AND BOARD RECOMMENDATIONS |
ITEM 1 Election of 12 |
The Board recommends a vote FOR each nominee. ● Highly qualified Board with diversity in backgrounds, skills and experiences. ● Relevant expertise to provide oversight and guidance for Abbott’s diversified operating model. ● See pages 9 to 24 for more information. | |
ITEM 2 Ratification of |
The Board recommends a vote FOR this item. ● Independent firm with significant industry and financial reporting expertise. ● See pages 76 to 77 for more information. | |
ITEM 3 Say on Pay: Advisory Vote |
The Board recommends a vote FOR the approval of the named officers’ compensation. ● Market-based structure producing differentiated awards based on both company and individual performance, managed with independent oversight by the Compensation Committee. ● Aligned to drive Abbott’s strategic priorities, reflects strong sustainable performance resulting in total shareholder return (TSR) above the peer median on a one-year and five-year basis. ● See pages 78 and 79 for more information. |
| 8 | |
ELECTION OF DIRECTORS (ITEM 1 ON PROXY CARD)
 |
ROBERT J. ALPERN, M.D. Director Since 2008 Age 74 Ensign Professor of Medicine and Physiology and Professor of Internal Medicine and Cellular and Molecular Physiology, and Former Dean of Yale School of Medicine |
PROFESSIONAL BACKGROUND
| ● | Ensign Professor of Medicine and Professor of Internal Medicine at Yale School of Medicine since June 2004. |
| ● | Dean of Yale School of Medicine from June 2004 to January 2020. |
| ● | Dean of The University of Texas Southwestern Medical School from July 1998 to May 2004. |
| ● | Served on the Board of Directors of Yale New Haven Hospital from October 2005 to January 2020. |
OTHER PUBLIC COMPANY BOARDS
AbbVie Inc.
KEY QUALIFICATIONS AND EXPERTISE
As a result of his long-tenured leadership positions at the Yale School of Medicine and The University of Texas Southwestern Medical School, and as a former Director on the Board of Yale New Haven Hospital, Dr. Alpern contributes valuable insights to the Board through his medical and scientific expertise and his knowledge of the healthcare environment and the scientific nature of Abbott’s key research and development initiatives.
 |
CLAIRE BABINEAUX-FONTENOT Director Since 2022 Age 60 Chief Executive Officer, Feeding America |
PROFESSIONAL BACKGROUND
| ● | Chief Executive Officer of Feeding America, a U.S. hunger-relief charitable organization, since 2018. |
| ● | Founder of CBF Consulting Group, LLC, a business consulting firm, since 2017. |
| ● | Executive Vice President and Global Treasurer of Walmart Inc., a multinational retail corporation operating supercenters, discount department stores, and eCommerce websites, from 2014 to 2017. |
| ● | Senior Vice President and Chief Tax Officer of Walmart, from 2007 to 2014. |
| ● | Vice President of Audits and Tax Policy of Walmart, from 2004 to 2007. |
| ● | Serves on the Board of Directors of New York Life Insurance Company and served on the Board of Directors of Charah Solutions, Inc. from 2018 to 2019. |
KEY QUALIFICATIONS AND EXPERTISE
As the Chief Executive Officer of Feeding America, Ms. Babineaux-Fontenot provides Abbott’s Board with substantial experience in organizational governance, strategic planning, and supply chain and infrastructure management, and through her prior financial leadership roles at Walmart, Ms. Babineaux-Fontenot contributes extensive expertise and knowledge of global risk management and corporate finance and accounting matters for a multinational public company.
|
9 |
 |
SALLY E. BLOUNT, PH.D. Director Since 2011 Age 63 President and Chief Executive Officer, Catholic Charities of the Archdiocese of Chicago, and Michael L. Nemmers Professor of Strategy and Former Dean of the J.L. Kellogg Graduate School of Management at Northwestern University |
PROFESSIONAL BACKGROUND
| ● | President and Chief Executive Officer of Catholic Charities of the Archdiocese of Chicago since August 2020. |
| ● | Michael L. Nemmers Professor of Strategy at the J.L. Kellogg Graduate School of Management at Northwestern University since 2010. |
| ● | Dean of the J.L. Kellogg Graduate School of Management at Northwestern University from 2010 to 2018. |
| ● | Dean of the New York University Undergraduate College and Vice Dean of its Leonard N. Stern School of Business from 2004 to 2010. |
| ● | Professor at the New York University Leonard School of Business from 2001 to 2010, and became the Abraham L. Gitlow Professor of Management in 2004. |
| ● | Held academic posts at the University of Chicago’s Graduate School of Business from 1992 to 2001. |
| ● | Serves on the Board of Directors of the Joyce Foundation. |
| ● | Served on the Board of Directors of Ulta Beauty, Inc. from 2017 to 2022 and on the Board of Directors of the Economic Club of Chicago from 2017 to 2023. |
KEY QUALIFICATIONS AND EXPERTISE
As a professor of management and strategy, having served as Dean of the J.L. Kellogg Graduate School of Management at Northwestern University and as Vice Dean and Dean of the Undergraduate College of New York University’s Leonard N. Stern School of Business, Dr. Blount provides Abbott’s Board with expertise on business organization, strategy, governance and management matters.
 |
ROBERT B. FORD Director Since 2019 Age 51 Chairman of the Board and Chief Executive Officer, Abbott Laboratories |
PROFESSIONAL BACKGROUND
| ● | Chairman of the Board and Chief Executive Officer of Abbott since December 2021. |
| ● | President and Chief Executive Officer of Abbott from March 2020 to December 2021. |
| ● | President and Chief Operating Officer of Abbott from 2018 to 2020. |
| ● | Executive Vice President, Medical Devices of Abbott from 2015 to 2018. |
| ● | Senior Vice President, Diabetes Care of Abbott from 2014 to 2015. |
| ● | Held various leadership roles across Abbott’s Diagnostics, Nutrition, and Diabetes Care businesses in the U.S. and Latin America since joining Abbott in 1996. |
KEY QUALIFICATIONS AND EXPERTISE
As Abbott’s Chairman of the Board and Chief Executive Officer, and having previously held various leadership positions at Abbott, including Chief Operating Officer, where he was responsible for all of Abbott’s operating businesses, Mr. Ford contributes an extensive knowledge of the Company’s global operations, a wide breadth of experience in strategy and execution, and valuable insights into global healthcare markets.
| 10 | |
 |
PAOLA GONZALEZ Director Since 2021 Age 53 Vice President, Global FP&A, The Clorox Company |
PROFESSIONAL BACKGROUND
| ● | Vice President, Global FP&A of The Clorox Company, a manufacturer and marketer of consumer and professional products, since June 2023. |
| ● | Vice President and Treasurer of Clorox, responsible for treasury, investor relations, and real estate, from 2018 to 2023. |
| ● | Vice President of Finance, Household and Lifestyle Segments of Clorox from 2010 to 2017. |
| ● | Vice President of Finance, Global Strategic Initiatives of Clorox from 2008 to 2010. |
| ● | Held various leadership roles in finance across Clorox since joining Clorox in 1997. |
| ● | Prior to Clorox, worked in finance for American Airlines in Latin America. |
KEY QUALIFICATIONS AND EXPERTISE
As Vice President, Global FP&A of The Clorox Company, pursuant to which she provides financial leadership across all Clorox businesses and business development efforts, and through her prior roles in treasury, investor relations, and several of Clorox’s businesses, Ms. Gonzalez has considerable experience providing financial leadership to a multinational public company with multiple businesses, contributing significant financial expertise and knowledge of financial statements, corporate finance and accounting matters.
 |
MICHELLE A. KUMBIER Director Since 2018 Age 57 President, Turf & Consumer Products, Briggs & Stratton, LLC |
PROFESSIONAL BACKGROUND
| ● | Senior Vice President and President, Turf & Consumer Products of Briggs & Stratton, LLC, a manufacturer and marketer of engines, batteries, and outdoor power equipment, since March 2022. |
| ● | Senior Vice President and Chief Operating Officer of Harley-Davidson Motor Company, a motorcycle and related products manufacturer, from 2017 to 2020. |
| ● | Senior Vice President of Motor Company Product and Operations of Harley-Davidson from 2015 to 2017. |
| ● | Held various other executive roles across Harley-Davidson, from 1997 to 2015. |
| ● | Held various positions at Kohler Company, maker of premium plumbing products, from 1986 to 1997. |
OTHER PUBLIC COMPANY BOARDS
Teledyne Technologies Incorporated, Ryerson Holding Corporation
KEY QUALIFICATIONS AND EXPERTISE
Having served in several executive roles at Harley-Davidson, Ms. Kumbier contributes extensive experience in the management of a multinational public company, including significant manufacturing, product development, commercial, business development and strategic planning experience.
|
11 |
 |
DARREN W. MCDEW Director Since 2019 Age 64 Retired General, United States Air Force, and Former Commander of U.S. Transportation Command |
PROFESSIONAL BACKGROUND
| ● | Four-star general who served for 36 years in the United States military before retiring in October 2018. |
| ● | Commander, U.S. Transportation Command, the single manager for global air, land and sea transportation for the U.S. Department of Defense from 2015 to 2018. |
| ● | Held various leadership roles across the U.S. Military, including Vice Director for Strategic Plans and Policy for the Joint Chiefs of Staff, Military Aide to the President, Director of Air Force Public Affairs, and Chief of Air Force Senate Liaison Division. |
| ● | Serves on the Board of Directors of United Services Automobile Association, Boys & Girls Club of America, and Manns Home Youth Foundation. |
OTHER PUBLIC COMPANY BOARDS
Parsons Corporation, General Electric Company
KEY QUALIFICATIONS AND EXPERTISE
Through his extensive leadership in the U.S. Air Force, General McDew contributes significant experience managing large, complex global operations, including strategic planning, security and risk management, cybersecurity, and supply chain and infrastructure management, succession planning and leadership development.
 |
NANCY MCKINSTRY Lead Independent Director Director Since 2011 Age 66 Chief Executive Officer and Chairman of the Executive Board, Wolters Kluwer N.V. |
PROFESSIONAL BACKGROUND
| ● | Chief Executive Officer and Chairman of the Executive Board of Wolters Kluwer N.V., a global information, software, and services provider, since September 2003, and a member of its Executive Board since June 2001. Ms. McKinstry has announced her retirement, effective February 2026. |
| ● | Member of the European Round Table of Industrialists. |
| ● | Serves on the Board of Directors of Russell Reynolds Associates and the Board of Overseers of Columbia Business School. |
| ● | Served on the Board of Directors of Telefonaktiebolaget LM Ericsson from 2004 to 2012. |
OTHER PUBLIC COMPANY BOARDS
Accenture plc
KEY QUALIFICATIONS AND EXPERTISE
As the Chief Executive Officer and Chairman of the Executive Board of Wolters Kluwer N.V., Ms. McKinstry contributes global perspectives and management experience in a broad range of key issues impacting a large multinational business such as Abbott’s, including global strategy and operations, risk management, corporate finance and financial reporting, and regulatory and compliance matters.
| 12 | |
 |
MICHAEL G. O’GRADY Director Since 2023 Age 59 Chairman and Chief Executive Officer, Northern Trust Corporation |
PROFESSIONAL BACKGROUND
| ● | Chairman of Northern Trust Corporation, a financial services company, since 2019, Chief Executive Officer since 2018, and President since 2017. |
| ● | President, Corporate & Institutional Services of Northern Trust from 2014 to 2016. |
| ● | Chief Financial Officer of Northern Trust from 2011 to 2014. |
| ● | Managing Director, Investment Banking Group of Bank of America Merrill Lynch from 2000 to 2011. |
OTHER PUBLIC COMPANY BOARDS
Northern Trust Corporation
KEY QUALIFICATIONS AND EXPERTISE
As the Chairman and Chief Executive Officer of Northern Trust Corporation, Mr. O’Grady has significant experience leading a global public company in a highly regulated industry, including oversight of operations and risk management, strategy and business development, and corporate governance. Mr. O’Grady also contributes broad financial expertise, including extensive experience in financial advisory and investment banking matters.
 |
MICHAEL F. ROMAN Director Since 2021 Age 65 Retired Chairman of the Board, President and Chief Executive Officer, 3M Company |
PROFESSIONAL BACKGROUND
| ● | Executive Chairman of the Board of 3M Company, a global manufacturing and technology company, from May 2024 to March 2025. |
| ● | Chairman of the Board, President and Chief Executive Officer of 3M from May 2019 to April 2024. |
| ● | Chief Executive Officer of 3M from July 2018 to May 2019. |
| ● | Chief Operating Officer and Executive Vice President of 3M from July 2017 to June 2018 with direct responsibilities for 3M’s five business groups and its international operations. |
| ● | Executive Vice President, Industrial Business Group of 3M from June 2014 to July 2017. |
| ● | Senior Vice President, Business Development of 3M from May 2013 to June 2014. |
| ● | Vice President and General Manager of Industrial Adhesives and Tapes Division of 3M from September 2011 to May 2013. |
KEY QUALIFICATIONS AND EXPERTISE
Having served as 3M Company’s Executive Chairman and its Chairman of the Board, President and Chief Executive Officer, Mr. Roman has extensive experience leading a multinational public company with multiple businesses, contributing significant manufacturing, supply chain, technology, and finance experience, as well as valuable insights into corporate strategy and risk management.
|
13 |
 |
DANIEL J. STARKS Director Since 2017 Age 70 Retired Chairman, President and Chief Executive Officer, St. Jude Medical, Inc. |
PROFESSIONAL BACKGROUND
| ● | Executive Chairman of the Board of St. Jude Medical, Inc., a medical device manufacturer, from January 2016 to January 2017, when Abbott completed its acquisition of St. Jude Medical. |
| ● | Chairman, President and Chief Executive Officer of St. Jude Medical from 2004 until his retirement in January 2016. |
| ● | President and Chief Operating Officer of St. Jude Medical from 2001 to 2004. |
| ● | President and CEO, Cardiac Rhythm Management Business of St. Jude Medical from 1997 to 2001. |
KEY QUALIFICATIONS AND EXPERTISE
Having served as St. Jude Medical’s Executive Chairman and its Chairman, President and Chief Executive Officer, and having joined St. Jude Medical in 1996, Mr. Starks contributes not only comprehensive and critical knowledge of the medical device industry, but also extensive business and management experience operating a global public company in a highly regulated industry.
 |
JOHN G. STRATTON Director Since 2017 Age 64 Executive Chairman, Frontier Communications Parent, Inc. |
PROFESSIONAL BACKGROUND
| ● | Executive Chairman of Frontier Communications Parent, Inc., a telecommunications company, since April 2021. |
| ● | Executive Vice President and President of Global Operations of Verizon Communications Inc. from 2015 to 2018. |
| ● | Executive Vice President and President of Global Enterprise and Consumer Wireline of Verizon from 2014 to 2015. |
| ● | President of Verizon Enterprise Solutions from 2012 to 2014. |
| ● | Chief Operating Officer and Executive Vice President of Verizon Wireless from 2010 to 2012. |
| ● | Member of The President’s National Security Telecommunications Advisory Committee from 2012 to 2018. |
| ● | Director of the Cellular Telecommunications Industry Association from 2015 to 2018. |
OTHER PUBLIC COMPANY BOARDS
Frontier Communications Parent, Inc., General Dynamics Corporation
KEY QUALIFICATIONS AND EXPERTISE
Through his executive leadership experience, Mr. Stratton contributes extensive business and management expertise operating a global public company such as Abbott, including valuable insights on corporate strategy and risk management. His service on the National Security Telecommunications Advisory Committee enables him to provide government perspective and experience in a highly regulated industry.
| 14 | |
THE BOARD OF DIRECTORS AND ITS COMMITTEES
| DIRECTOR INDEPENDENCE |
The Board has determined that each of following director nominees is independent in accordance with the New York Stock Exchange listing standards: Robert J. Alpern, M.D., Claire Babineaux-Fontenot, Sally E. Blount, Ph.D., Paola Gonzalez, Michelle A. Kumbier, Darren W. McDew, Nancy McKinstry, Michael G. O’Grady, Michael F. Roman, Daniel J. Starks, and John G. Stratton.
To make this determination, the Board applied the independence standards under the New York Stock Exchange listing standards. The Board also considered whether a director nominee has any other material relationships with Abbott or its subsidiaries and concluded that none of them had a relationship that impaired his or her independence. This included consideration of the fact that some of the director nominees or their family members are officers or serve on boards of companies or entities to which Abbott sold products or made contributions or from which Abbott purchased products and services during the year. In making its determination, the Board relied on both information provided by the director nominees and information developed internally by Abbott.
| DIRECTOR SELECTION |
The Nominations and Governance Committee assists the Board of Directors in identifying individuals qualified to become Board members and recommends to the Board the nominees for election as directors at the next annual meeting of shareholders. The process used by the Nominations and Governance Committee to identify a nominee to serve as a Board member depends on the qualities being sought. From time to time, Abbott engages an executive search firm to assist the Committee in identifying individuals qualified to be Board members.
Board candidates are considered on the basis of a range of criteria and should have demonstrated experience and abilities that are relevant to the Board’s oversight role with respect to Abbott’s business and affairs. When combined, the backgrounds and qualifications of the director nominees should provide a portfolio of experience and knowledge that will serve Abbott’s governance and strategic needs. When selecting and evaluating nominees for the Board, the Nominations and Governance Committee and the Board may consider certain qualifications, such as strong backgrounds in management, medical and scientific research and development, finance, international business, and government. Abbott’s outline of directorship qualifications is included in Abbott’s Governance Guidelines. In addition, all Abbott directors must exhibit:
 |
Global business perspective |
|
Successful track record |
|
Innovative thinking |
|
Knowledge of corporate governance requirements and practices |
|
High integrity |
|
Commitment to good corporate citizenship |
A description of the procedure for the recommendation and nomination of directors by shareholders is on pages 82 and 83.
|
15 |
| BOARD COMPOSITION AND DIVERSITY |
In the process of identifying nominees to serve as members of the Board of Directors, the Nominations and Governance Committee considers the Board’s diversity of relevant experience, areas of expertise, ethnicity, gender, and geography.
The process used to identify and select nominees has resulted in a well-balanced, diverse, and highly qualified Board of Directors with the backgrounds, skills, and perspectives necessary to provide strong oversight and guidance. Each director nominee’s biography includes the particular experience and qualifications that led the Board to conclude that the nominee should serve on the Board. The director nominees’ biographies are on pages 9 through 14.
| THE 12 DIRECTOR NOMINEES COMPRISE A WELL-BALANCED, DIVERSE BOARD. | |||
| EXPERTISE ALIGNED WITH ABBOTT’S DIVERSIFIED OPERATING MODEL AND LONG-TERM STRATEGY | WELL-BALANCED TENURE | ||
| Healthcare Industry | 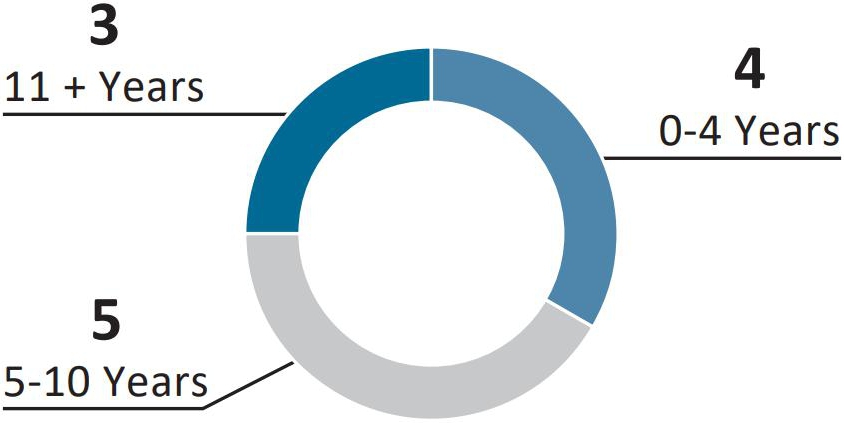 | ||
| Finance and Accounting | |||
| Science, Innovation, and Technology | |||
| Risk Management, including Data Protection and Cybersecurity | |||
| Global Strategy and Operations | BOARD DIVERSITY | ||
| Senior Leadership of Large, Complex Organizations | 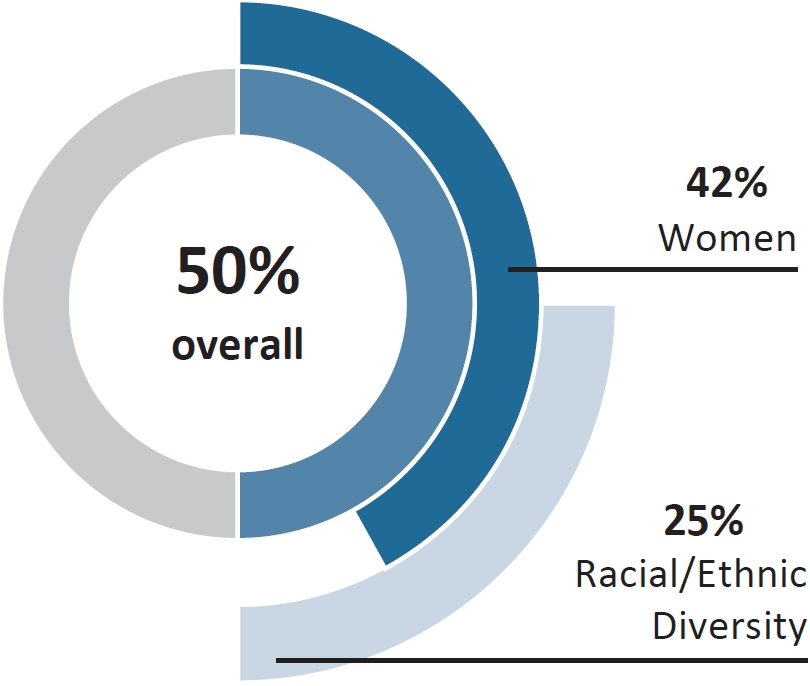 | ||
| Government, Regulatory and Compliance | |||
| Consumer Marketing and Brand Management | |||
| Sustainability and Corporate Responsibility | |||
| 16 | |
| LEADERSHIP STRUCTURE |
Abbott’s current Board leadership is comprised of the Chairman of the Board and CEO, a Lead Independent Director, and independent Committee Chairs. The Board reviews its leadership structure at least annually and has determined that this structure is in the best interests of Abbott and its shareholders at this time. This structure balances strong, independent oversight with extensive business knowledge and experience. The Board also retains the flexibility necessary to adopt the leadership structure in the best interests of Abbott and its shareholders based on the specific circumstances and needs of the business over time.
Robert B. Ford currently serves as Chairman of the Board and CEO. The Board has determined that this is in the best interests of Abbott and its shareholders, as it provides cohesive leadership and direction for the Board and executive management, as well as clear accountability and unified leadership in the oversight and execution of strategic initiatives and business plans. Mr. Ford has extensive industry expertise and familiarity with Abbott’s diverse, global businesses, such that his strategic and operational insights provide the Board with a comprehensive vision, from long-term strategic direction to day-to-day execution.
Abbott’s Board also maintains a strong Lead Independent Director with significant roles and responsibilities, who is appointed by and from the independent directors. In selecting a Lead Independent Director, the independent directors consider several factors, including corporate governance expertise, board service and tenure, ability to meet the required time commitment, and operational and leadership experience. Key functions and responsibilities of the Lead Independent Director include:
| ● | Preside at regularly conducted executive sessions of the independent directors and provide feedback to the Chairman and CEO and other senior management, as appropriate, |
| ● | Preside at all meetings of the Board at which the Chairman is not present, |
| ● | Facilitate communication with the Board and serve as liaison between the Chairman and the independent directors, |
| ● | Authority to call meetings of the independent directors, |
| ● | Review and communicate with the Chairman regarding appropriate agenda topics, and schedule sufficiency, |
| ● | Lead the Board’s annual evaluation of the Chairman of the Board and CEO, |
| ● | Lead the annual performance review process, |
| ● | Consult with management on corporate governance issues and developments, |
| ● | Confer with the Nominations and Governance Committee and the CEO regarding senior management succession planning, and |
| ● | Engage directly with major shareholders as appropriate. |
Throughout the year, the Board and its Committees conduct a thorough review of Abbott’s corporate governance structures, taking into account the results of the annual shareholders meeting and shareholder feedback; the results of annual Board, Committee, and director assessments; regulatory developments; and advancements in the areas of corporate governance, compensation, and sustainability.
|
17 |
In addition, as part of its regular succession planning, the Board monitors the composition of backgrounds, skills, and experiences contributed by each of the directors, as well as director tenures and upcoming retirements. Based on these ongoing evaluations, the Board takes actions to continue shaping the Board’s leadership structure and composition to best serve the interests of Abbott and its shareholders. Such actions include evaluating director candidates to supplement the Board’s portfolio of skills, appointing new directors well in advance of anticipated retirement to provide sufficient time for onboarding and transfer of institutional knowledge, and adjusting Board Committee leadership and composition to refresh perspectives and further director development.
Abbott’s Board leadership is further strengthened by:
| ● | Eleven out of twelve director nominees are independent |
| ● | Demonstrated commitment to Board refreshment – six new independent directors in the last six years, three of whom are women and three of whom are minorities |
| ● | Fully independent Board Committees – Audit Committee, Compensation Committee, Nominations and Governance Committee, and Public Policy Committee |
| ● | Committee Chairs who are recommended to the Board by the Nominations and Governance Committee and approved by the full Board |
| ● | Executive sessions of the independent directors, led by the Lead Independent Director, at each regularly scheduled Board meeting |
| ● | Annual election of directors by majority vote |
| ● | Annual evaluations of the Board, each Committee, and each director, including the Chairman of the Board and CEO, that are led by the Lead Independent Director and conducted anonymously to facilitate candid feedback |
| ● | Review of Chairman and CEO performance and approval of compensation by independent directors and fully independent Committees |
| ● | Private Committee sessions with members of senior management |
| 18 | |
| BOARD OVERSIGHT |
Abbott is committed to strong governance that is aligned with shareholder interests. Our Board spends significant time with Abbott’s senior management to understand global dynamics, challenges, and opportunities for Abbott. During these interactions, directors provide insights and ask probing questions, which guide management decision making. This collaborative approach to risk oversight and emphasis on long-term sustainability begins with our leaders and is ingrained in Abbott’s culture.
OVERSIGHT OF RISK
The Board has risk oversight responsibility for Abbott, which it administers directly and with assistance from its Committees. Throughout the year, the Board and its Committees engage with management to discuss a wide range of enterprise risks, such as risks related to Abbott’s businesses, enterprise and product cybersecurity, litigation, and human capital management. The Audit Committee conducts an annual review of the enterprise risk management process, including the program structure, risk assessment, and risk mitigation. The Board and its Committees also consult with advisors, including legal counsel, internal and external auditors, and consultants. Such engagement and consultations are done by the full Board, independent directors in executive sessions, or fully independent Committees, as appropriate.
Specific risk areas of focus for the Board, its Committees, and management include:
| BOARD OF DIRECTORS | ||
● Business
strategy and operations
● Management
development and succession planning
● Human
capital management
● Litigation
| ||
 |
||
AUDIT COMMITTEE ● Accounting, internal controls, and financial reporting ● Enterprise cybersecurity ● Information security ● Major financial and business risk exposures |
COMPENSATION COMMITTEE ● Executive officer compensation, including incentive compensation plans ● Equity-based plans ● Director compensation |
NOMINATIONS AND GOVERNANCE COMMITTEE ● Board composition, refreshment, and succession planning ● Board governance structure ● Governance guidelines and practices |
PUBLIC POLICY COMMITTEE ● Sustainability, environment, and social responsibility ● Regulatory compliance, product quality, and global ethics and compliance programs ● Product cybersecurity and data privacy | ||||||
|
||
MANAGEMENT ● Design and execution of Abbott’s enterprise risk management process ● Identification, evaluation, and prioritization of risks ● Development and implementation of mitigating actions ● Regular communication with the Board and its Committees on how risks are being managed | ||
|
19 |
OVERSIGHT OF STRATEGY
One of the Board’s key responsibilities is overseeing and monitoring business strategy. The Board conducts an annual in-depth review of the long-term strategy and areas of focus for Abbott and its businesses. The Board also regularly engages with management throughout the year to review and discuss the strategic planning for Abbott’s businesses, including operating and financial plans, strategic business priorities and initiatives, and key risks and opportunities. These reviews include discussions of matters such as global talent management and succession planning, global market dynamics and changes in regulatory and competitive landscapes, supply chain initiatives and sustainability programs, and significant corporate actions such as acquisitions and capital expenditures.
The Board monitors management’s strategy execution, receiving regular updates to confirm that activities align with such strategies and that progress is made toward strategic objectives. Most years, the Board also visits Abbott facilities and locations around the world to observe business dynamics and strategy execution by the businesses.
| COMMITTEES OF THE BOARD OF DIRECTORS |
The Board of Directors has five committees established in Abbott’s By-Laws: Audit Committee, Compensation Committee, Nominations and Governance Committee, Public Policy Committee, and Executive Committee.
All members of the Audit Committee, Compensation Committee, Nominations and Governance Committee, and Public Policy Committee are independent. These Committees are governed by written charters setting forth their respective responsibilities, and each Committee reviews its charter at least annually, with any changes being recommended to the full Board for approval. Copies of the Committee charters are all available in the governance section of Abbott’s investor relations website (www.abbottinvestor.com).
| COMMITTEE MEMBERSHIPS | ||||||||||
| Current Members | Audit Committee* |
Compensation Committee |
Nominations and Governance Committee |
Public Policy Committee |
Executive Committee | |||||
| Robert J. Alpern, M.D. |  |
|
||||||||
| Claire Babineaux-Fontenot |  |
|
||||||||
| Sally E. Blount, Ph.D. | |
|
||||||||
| Robert B. Ford |  | |||||||||
| Paola Gonzalez | |
|
||||||||
| Michelle A. Kumbier | |
|
||||||||
| Darren W. McDew | |
|
||||||||
| Nancy McKinstry | |
|
| |||||||
| Michael G. O’Grady | |
|
||||||||
| Michael F. Roman | |
|
| |||||||
| Daniel J. Starks |  |
|
| |||||||
| John G. Stratton | |
|
| |||||||
| Total Meetings Held in 2024 | 7 | 3 | 4 | 4 | 0 | |||||
|
Chair | |
Member |
| * | Each of the committee members is financially literate, as is required of audit committee members by the New York Stock Exchange. The Board of Directors has determined that Nancy McKinstry is an “audit committee financial expert.” |
| 20 | |
AUDIT COMMITTEE
The Audit Committee assists the Board of Directors in fulfilling its oversight responsibility with respect to:
| ● | Abbott’s accounting and financial reporting practices and the audit process, |
| ● | The quality and integrity of Abbott’s financial statements, |
| ● | The independent auditors’ qualifications, independence, and performance, |
| ● | The performance of Abbott’s internal audit function and internal auditors, |
| ● | Legal and regulatory compliance relating to financial matters, including accounting, auditing, financial reporting, and securities law issues, and |
| ● | Enterprise risk management, including major financial, information security, and enterprise cybersecurity risk exposures. |
In performing these functions, the Audit Committee meets regularly with the independent auditor, Abbott’s management, and Abbott’s internal auditors to review the adequacy, effectiveness and quality of Abbott’s accounting and financial reporting principles, policies, procedures and controls, as well as Abbott’s enterprise risk management, including Abbott’s risk assessment and risk management policies. The Audit Committee also receives regular reports from management on Abbott’s information security and enterprise cybersecurity risk programs.
A copy of the report of the Audit Committee is on page 77.
COMPENSATION COMMITTEE
The Compensation Committee assists the Board of Directors in carrying out the Board’s responsibilities relating to the compensation of Abbott’s executive officers and directors. Its primary responsibilities include:
| ● | Review, approve, and administer the incentive compensation plans in which any executive officer participates and all of Abbott’s equity-based plans. The Compensation Committee may delegate the responsibility to administer and make grants under these plans to management, except to the extent that such delegation would be inconsistent with applicable law or regulation or with the listing rules of the New York Stock Exchange. |
| ● | Review director compensation annually and recommend to the full Board both the amount and the allocation between equity-based awards and cash. In recommending director compensation, the Compensation Committee takes comparable director fees into account and reviews any arrangement that could be viewed as indirect director compensation. |
| ● | Engage compensation consultants to provide counsel and advice on executive and non-employee director compensation matters. The consultant and its principal report directly to the Chair of the Committee. The principal meets regularly and as needed with the Committee in executive sessions, has direct access to the Chair during and between meetings, and performs no other services for Abbott or its senior executives. |
| The Committee determines what variables it will instruct the consultant to consider, including peer groups against which performance and pay should be examined, financial metrics to be used to assess Abbott’s relative performance, competitive incentive practices in the marketplace, and compensation levels relative to market practice. The Committee negotiates and approves any fees paid to the consultant for these services. |
The Compensation Committee engaged Meridian Compensation Partners, LLC as its compensation consultant for 2024. Meridian performs no other work for Abbott. Based on its evaluation of Meridian’s independence in accordance with the New York Stock Exchange listing standards and information provided by Meridian, the Committee determined that the work performed by Meridian does not present any conflicts of interest.
A copy of the report of the Compensation Committee is on page 53.
|
21 |
NOMINATIONS AND GOVERNANCE COMMITTEE
The Nominations and Governance Committee assists the Board in fulfilling its oversight responsibility with respect to governance matters. Its primary responsibilities include:
| ● | Assist the Board in identifying individuals qualified to become Board members, and recommend to the Board the nominees for election as directors at the next annual meeting of shareholders, |
| ● | Recommend to the Board the people to be elected as executive officers of Abbott, |
| ● | Develop and recommend to the Board the corporate governance guidelines applicable to Abbott, and |
| ● | Serve in an advisory capacity to the Board and the Chairman of the Board on matters of organization, management succession plans, major changes in the organizational structure of Abbott, and the conduct of Board activities. |
The process used by this Committee to identify a nominee to serve as a member of the Board of Directors depends on the qualities being sought. From time to time, Abbott engages an executive search firm to assist the Committee in identifying individuals qualified to be Board members. The process used by the Committee to identify nominees is described on page 15 in the section captioned, “Director Selection.”
PUBLIC POLICY COMMITTEE
The Public Policy Committee assists the Board of Directors in fulfilling its oversight responsibility with respect to:
| ● | Legal, regulatory, and healthcare compliance matters, including evaluating Abbott’s compliance policies and practices and reviewing Abbott’s compliance program, |
| ● | Product quality, product cybersecurity, and data privacy matters, |
| ● | Governmental affairs and political participation, including advocacy priorities, political contributions, lobbying activities, and trade association memberships, |
| ● | Sustainability and social responsibility policies, practices, and goals and targets, and |
| ● | Social, political, economic, and environmental trends and public policy issues that affect or could affect Abbott’s business activities, performance, and public image. |
EXECUTIVE COMMITTEE
The Executive Committee may exercise all the authority of the Board in the management of Abbott, except for matters expressly reserved by law for Board action.
| 22 | |
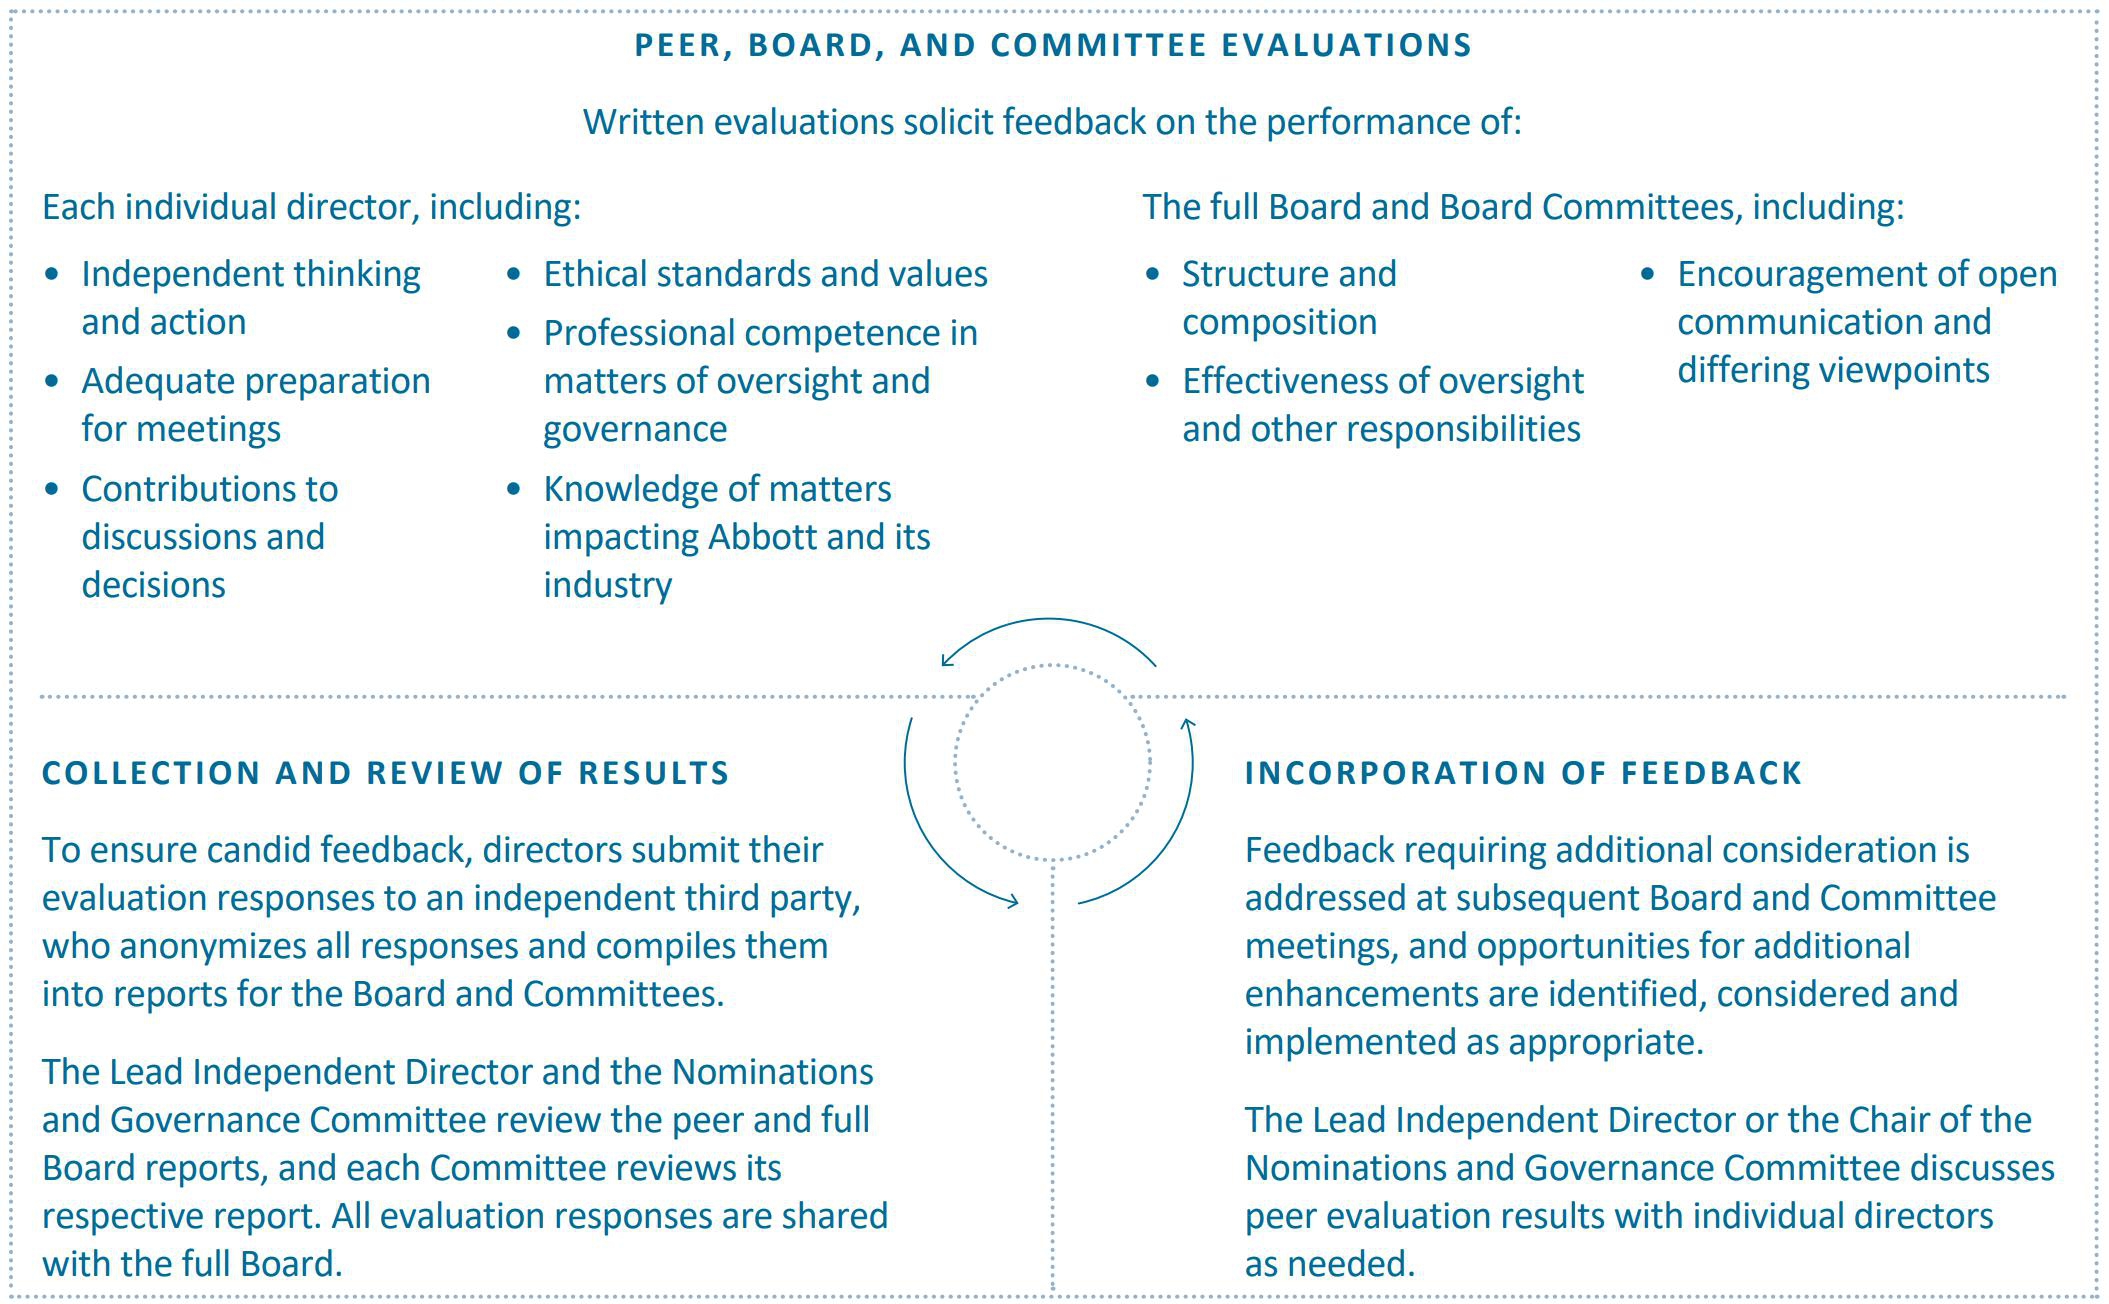
| BOARD EVALUATION PROCESS |
Each year, under the leadership of the Lead Independent Director and together with the Chair of the Nominations and Governance Committee, Abbott’s directors evaluate the effectiveness of the Board and its Committees in performing its governance and risk oversight responsibilities. Directors assess the performance of their peers, as well as the full Board of Directors and each of the Committees on which they serve, as follows:
| BOARD MEETINGS AND DIRECTOR COMMITMENTS |
The Board of Directors held 8 meetings in 2024. The average attendance of all directors at Board and committee meetings in 2024 was 99%, and each director attended at least 75% of the total number of Board meetings and meetings of the committees on which he or she served. Abbott encourages its Board members to attend the annual shareholders meeting. Last year, all of Abbott’s directors attended the annual shareholders meeting.
Directors must devote sufficient time to fulfill their responsibilities as directors in accordance with the criteria set forth in Abbott’s Governance Guidelines, which are available in the corporate governance section of Abbott’s investor relations website (www.abbottinvestor.com). Accordingly, service on the board of directors of other public companies must be limited so as not to conflict with the responsibilities of Abbott directors. Directors are expected to inform the Chairman of the Board and the Chair of the Nominations and Governance Committee of any public company directorships that they have been offered before accepting any such directorship, so as to allow for evaluation of whether the new directorship creates any concerns or potential conflicts of interest. In addition, no director may serve on the board of directors of an Abbott competitor.
|
23 |
As set forth in Abbott’s Governance Guidelines, in order to be renominated, incumbent directors must demonstrate certain key characteristics, including:
| ● | Adequate preparation for board and committee meetings, |
| ● | Participation in and contributions to board and committee discussions, |
| ● | Providing on-going advice and counsel to management on the director’s own initiative and when requested by management, |
| ● | Regular attendance at board and committee meetings, and |
| ● | Maintaining an independent familiarity with the external environments in which Abbott operates and especially in the director’s own particular fields of expertise. |
Each incumbent director is evaluated on the above criteria by each of his or her peers as part of the annual Board evaluation process, which occurs prior to renomination of any incumbent director for the next annual shareholders meeting. The Board’s evaluation process is discussed on page 23.
| SHAREHOLDER ENGAGEMENT AND FEEDBACK |
In 2024, we contacted shareholders representing over 60% of our outstanding shares to discuss our compensation program and various topics:
| ● | Rigorous Goal Setting: We link executive pay to performance against operating and financial plans, strategic business priorities, initiatives, and human capital metrics. |
| ● | Human Capital Management: Our robust talent management process ensures we cultivate the talent essential for today and tomorrow. We achieve this by providing exceptional development and advancement opportunities, offering unique benefits that support employees and their families, and enabling meaningful work that makes a difference. |
| ● | Peer Review Process: Grounded in good governance principles, our Compensation Committee conducts annual reviews of the peer group to ensure that Abbott remains well-positioned in terms of size, growth, return profiles, geographic breadth, and management structure. |
| ● | Board Composition and Succession Planning: Since 2018, we have added six new independent directors, including three women and three minorities, enhancing our board’s diversity and expertise. |
| COMMUNICATING WITH THE BOARD OF DIRECTORS |
Interested parties may communicate with the Board of Directors by writing a letter to the Chairman of the Board, to the Lead Independent Director, or to the independent directors c/o Abbott Laboratories, 100 Abbott Park Road, D-364, AP6D, Abbott Park, Illinois 60064, Attention: Corporate Secretary. The General Counsel and Corporate Secretary regularly forwards to the addressee all letters other than mass mailings, advertisements, and other materials not relevant to Abbott’s business. In addition, directors regularly receive a log of all correspondence received by Abbott that is addressed to a member of the Board and may request any correspondence on that log.
| 24 | |
| CORPORATE GOVERNANCE MATTERS |
Abbott’s corporate governance guidelines,
outline of directorship qualifications, director independence standards, code of business conduct, and the charters of Abbott’s
Audit Committee, Compensation Committee, Nominations and Governance Committee, and Public Policy Committee are all available in
the corporate governance section of Abbott’s investor relations website (www.abbottinvestor.com). Abbott has an
| DIRECTOR COMPENSATION |
Mr. Ford is not compensated for serving on the Board or Board committees. Abbott’s remaining directors, who are all non-employee directors, are compensated for their service under the Abbott Laboratories Non-Employee Directors’ Fee Plan and the Abbott Laboratories 2017 Incentive Stock Program.
The following table sets forth a summary of the non-employee directors’ 2024 compensation.
| Name | Fees
Earned or Paid in Cash ($)(1) |
Stock Awards ($)(2) |
Option Awards ($)(3) |
Change
in Pension Value and Nonqualified Deferred Compensation Earnings ($)(4) |
All
Other Compensation ($)(5) |
Total ($) | ||||||||||||
| R. J. Alpern | $ | 126,000 | $ | 199,892 | $ | 0 | $ | 121,173 | $ | 25,000 | $ | 472,065 | ||||||
| C. Babineaux-Fontenot | 132,000 | 199,892 | 0 | 0 | 25,000 | 356,892 | ||||||||||||
| S. E. Blount | 126,000 | 199,892 | 0 | 14,973 | 25,000 | 365,865 | ||||||||||||
| P. Gonzalez | 132,000 | 199,892 | 0 | 0 | 25,000 | 356,892 | ||||||||||||
| M. A. Kumbier | 132,000 | 199,892 | 0 | 0 | 0 | 331,892 | ||||||||||||
| D. W. McDew | 126,000 | 199,892 | 0 | 0 | 0 | 325,892 | ||||||||||||
| N. McKinstry | 0 | 199,892 | 196,000 | 0 | 0 | 395,892 | ||||||||||||
| M. G. O’Grady | 0 | 199,892 | 126,000 | 0 | 0 | 325,892 | ||||||||||||
| M. F. Roman | 141,000 | 199,892 | 0 | 0 | 0 | 340,892 | ||||||||||||
| D. J. Starks | 0 | 199,892 | 151,000 | 0 | 0 | 350,892 | ||||||||||||
| J. G. Stratton | 147,000 | 199,892 | 0 | 0 | 0 | 346,892 | ||||||||||||
| (1) | Under the Abbott Laboratories Non-Employee Directors’ Fee Plan, non-employee directors earn $10,500 for each month of service as a director. Audit Committee members, other than the Audit Committee chair, receive $500 for each month of service on the Audit Committee. Board Committee chairs receive monthly fees of: $2,500 for the Audit Committee chair, $2,083.33 for the Compensation Committee chair, $1,250 for the Nominations and Governance Committee chair, $1,250 for the Public Policy Committee chair, and $3,333.33 for the lead independent director. Effective as of May 1, 2025, the Board committee chair monthly fees for the Nominations and Governance Committee chair and the Public Policy Committee chair will be $2,083.33. Fees earned under the Abbott Laboratories Non-Employee Directors’ Fee Plan are paid in cash to the director, paid in the form of vested non-qualified stock options, deferred (as a non-funded obligation of Abbott), or paid currently into an individual grantor trust established by the director. The distribution of deferred fees and amounts held in a director’s grantor trust generally commences when the director reaches age 65, or upon retirement from the Board of Directors, |
|
25 |
| if later. The director may elect to have deferred fees and fees deposited in trust credited to either a guaranteed interest account or to a stock equivalent account that earns the same return as if the fees were invested in Abbott shares. If necessary, Abbott contributes funds to a director’s trust so that as of year-end the stock equivalent account balance (net of taxes) is not less than seventy-five percent of the market value of the related common shares at year-end. | |
| (2) | The amounts reported in this column represent the grant date fair value of the awards calculated in accordance with Financial Accounting Standards Board ASC Topic 718. Abbott determines the grant date fair value of stock unit awards by multiplying the number of restricted stock units granted by the average of the high and low market prices of an Abbott common share on the date of grant. In addition to the fees described in footnote 1, each non-employee director elected to the Board of Directors at the annual shareholders meeting receives vested restricted stock units having a value of $200,000 (rounded down) under the Abbott Laboratories 2017 Incentive Stock Program (effective as of the 2025 Annual Meeting, this will increase to $210,000 (rounded down)). In 2024, this was 1,866 units. The non-employee directors receive cash payments equal to the dividends paid on the shares covered by the units at the same rate as other shareholders. Upon termination, retirement from the Board, death, or a change in control of Abbott, a non-employee director will receive one common share for each restricted stock unit outstanding under the Incentive Stock Program. Each director is required to own, within five years of becoming a director, the number of Abbott shares having a fair market value equal to five times the annual director fees earned or paid in cash. All directors with five years tenure or more meet or exceed the guidelines. The following Abbott restricted stock units were outstanding as of December 31, 2024: R. J. Alpern, 39,163; C. Babineaux-Fontenot, 3,682; S. E. Blount, 32,423; P. Gonzalez, 5,284; M. A. Kumbier, 10,998; D. W. McDew, 8,757; N. McKinstry, 32,423; M. G. O’Grady, 3,682; M. F. Roman, 6,783; D. J. Starks, 17,380; and J. G. Stratton, 13,943. |
| (3) | The amounts in this column represent the grant date fair value of non-qualified stock options granted in lieu of cash fees pursuant to the director’s election under the Non-Employee Directors’ Fee Plan, plus a cash payment in lieu of any fractional shares. Such options were vested in full on the grant date. These amounts were calculated in accordance with Financial Accounting Standards Board ASC Topic 718 as of the option’s grant date using a Black-Scholes stock option valuation model. These amounts are being reported solely for the purpose of comparative disclosure in accordance with the Securities and Exchange Commission’s rules. There is no certainty that the amount determined using a Black-Scholes stock option valuation model would be the value at which employee stock options would be traded for cash. The following options were outstanding as of December 31, 2024: N. McKinstry, 81,668; M. G. O’Grady, 8,980; and D. J. Starks, 13,413. |
| (4) | The totals in this column include reportable interest credited under Abbott Laboratories Non-Employee Directors’ Fee Plan during the year. |
| (5) | The amounts reported in this column represent charitable matching grant contributions. Charitable contributions made by Abbott’s non-employee directors are eligible for a matching contribution (up to $25,000 annually). |
| 26 | |
EXECUTIVE COMPENSATION
| COMPENSATION DISCUSSION AND ANALYSIS |
INTRODUCTION
This Compensation Discussion and Analysis (CD&A) describes Abbott’s executive compensation program in 2024. In particular, this CD&A explains how the Compensation Committee (the Committee) and Board of Directors made compensation decisions for the Company’s executives, including the six named officers: Robert B. Ford, Chairman of the Board and Chief Executive Officer; Philip P. Boudreau, Executive Vice President, Finance and Chief Financial Officer; Hubert L. Allen, Executive Vice President, General Counsel and Secretary; Lisa D. Earnhardt, Executive Vice President and Group President, Medical Devices; Daniel G. Salvadori, Executive Vice President and Group President, Established Pharmaceuticals and Nutritional Products; and Robert E. Funck, Jr., Former Executive Vice President, Finance.
The CD&A also describes the process the Committee utilizes to examine performance in the context of executive pay decisions, the performance goals and results for each named officer, and recent updates to our compensation program. This year’s CD&A reflects the feedback from our shareholders gathered during our 2024 shareholder outreach described on page 28.
VALUE CREATION FOR SHAREHOLDERS
Abbott’s strong sustainable performance has resulted in total shareholder return (TSR) above the peer median on a one-year and five-year basis.
On a one-year basis, our TSR performance placed us at the 58th percentile relative to our peers and on a five-year basis, our TSR performance placed us at the 68th percentile relative to our peers. These consistent top-tier returns are driven by strong execution, an effective governance structure, and the strength of our diversified business model with leadership positions in some of the largest and fastest growing markets in healthcare and innovative product portfolios across our businesses.
1-Year Total Shareholder Return
|
5-Year Total Shareholder Return
|
Abbott’s three-year TSR performance reflects our significant contributions to the fight against COVID-19. During 2022, which represents the starting point for three-year TSR measurement, we delivered $8.4 billion in COVID test sales. As the COVID pandemic shifted to an endemic state, in part due to the readily available testing produced by Abbott and other companies, the demand for testing declined and negatively impacted TSR. We are proud of how our company rose to the challenge during that troubling time. Extraordinary events, such as COVID, demonstrate why an over reliance on one fixed time-frame TSR measurement does not represent a complete picture of company performance.
|
27 |
In addition to delivering significant shareholder returns, Abbott continued to take important steps to position the Company for long-term, sustainable growth.
| ROBUST INNOVATION PIPELINE | INVESTING FOR FUTURE GROWTH | SHAREHOLDER RETURNS | ||
● Steady
cadence of important product approvals across our businesses that will be significant contributors to growth in the coming
years. This includes first-of-its-kind technology like TriClip® and Aveir® along with our
continuous glucose monitoring systems. |
● Increased manufacturing scale and capabilities across several important products. ● Invested nearly $2.2 billion in capital projects in the past year. |
● Returned
$5.1 billion to shareholders in 2024 and announced a 7.3% increase to our dividend for 2025, marking our 53rd consecutive
year of dividend increases.
|
| SHAREHOLDER ENGAGEMENT AND FEEDBACK |
In 2024, we contacted shareholders representing over 60% of our outstanding shares to discuss our compensation program and various topics:
| ● | Rigorous Goal Setting: We link executive pay to performance against operating and financial plans, strategic business priorities, initiatives, and human capital metrics. |
| ● | Human Capital Management: Our robust talent management process ensures we cultivate the talent essential for today and tomorrow. We achieve this by providing exceptional development and advancement opportunities, offering unique benefits that support employees and their families, and enabling meaningful work that makes a difference. |
| ● | Peer Review Process: Grounded in good governance principles, our Compensation Committee conducts annual reviews of the peer group to ensure that Abbott remains well-positioned in terms of size, growth, return profiles, geographic breadth, and management structure. |
| ● | Board Composition and Succession Planning: Since 2018, we have added six new independent directors, including three women and three minorities, enhancing our board’s diversity and expertise. |
The strength of our compensation program is evident in our Say-on-Pay voting results. Over the past five years, Abbott has averaged 91% support from shareholders.
Throughout the year, we actively engage with our shareholders and the broader corporate governance community. By proactively listening to and understanding their opinions, we ensure their voices are considered. This robust stakeholder engagement process has led to significant enhancements in our program and proxy statement.
| FALL ENGAGEMENT | PROXY STATEMENT | |
| Engage with consultants on executive compensation trends and market practices, risk assessment, evaluation of pay versus performance and regulatory updates. Contact proxy advisory firms to discuss company pay and performance alignment as well as any program changes. |  |
Board reviews shareholder feedback received throughout the year and uses that feedback to enhance disclosures, governance practices, executive compensation programs and other policies, as appropriate. |
 |
 | |
| ANNUAL MEETING | SPRING ENGAGEMENT | |
| Meet with shareholders to discuss prior year results and any areas of focus they may have for the upcoming year. Publish voting results for all shareholder proposals. |  |
Engage with key shareholders to discuss topics of interest with them and to share recent enhancements made to address any previous feedback. |
| 28 | |
| ABBOTT’S PEER GROUP FOR PAY AND COMPANY PERFORMANCE BENCHMARKING |
To determine the competitiveness of our compensation and benefit programs, the Committee, in consultation with its independent consultant, annually compares the level of compensation, pay practices, and our relative performance to those of peer companies. Our Compensation Committee reviewed our peer group in 2024 and determined that the existing peer group is positioned appropriately between size (revenue and market capitalization between approximately one-third and three-times Abbott’s), growth and return profiles, geographic breadth, and management and operating structure. This approach has been overwhelmingly supported by our investors during shareholder outreach.
The peer group is summarized below, showing the primary characteristics for each company selected, including the Abbott business segment(s) represented by the peer company.
| Company Name | Sales/ Rev.(1) (billions) |
Market Cap(1) (billions) |
%
Rev. Outside U.S. |
Similar
# Employees |
Mfg. Driven/ Consumer- Facing |
Abbott
Business Segment(s)/ Characteristics Represented | ||||||||
| 3M Company | $ | 23.6 | $ | 70.3 |  |
|
|
Consumer | ||||||
| Becton Dickinson | $ | 20.2 | $ | 65.8 |  |
|
|
Diagnostics, Medical Devices | ||||||
| Boeing | $ | 66.5 | $ | 132.2 | |
|
|
Diagnostics, Medical Devices | ||||||
| Boston Scientific | $ | 16.6 | $ | 131.6 | |
|
Medical Devices | |||||||
| Bristol-Myers Squibb | $ | 47.5 | $ | 114.7 | |
Established Pharmaceuticals | ||||||||
| Cisco | $ | 53.8 | $ | 235.8 | |
|
|
Diagnostics, Medical Devices | ||||||
| The Coca-Cola Company | $ | 46.2 | $ | 268.2 | |
|
|
Consumer | ||||||
| Danaher Corporation | $ | 23.9 | $ | 165.8 | |
|
|
Diagnostics | ||||||
| Honeywell International | $ | 38.3 | $ | 146.9 | |
|
|
Diagnostics, Medical Devices | ||||||
| Johnson & Johnson | $ | 88.8 | $ | 348.2 | |
|
|
Diagnostics,
Established Pharmaceuticals, Medical Devices | ||||||
| Medtronic | $ | 33.6 | $ | 102.4 | |
|
|
Medical Devices | ||||||
| Merck | $ | 64.0 | $ | 251.6 | |
|
|
Established Pharmaceuticals | ||||||
| Nike | $ | 46.1 | $ | 112.6 | |
|
|
Consumer | ||||||
| PepsiCo | $ | 92.1 | $ | 208.6 | |
|
Consumer | |||||||
| Pfizer | $ | 63.1 | $ | 150.3 | |
|
Established Pharmaceuticals | |||||||
| Procter & Gamble | $ | 85.2 | $ | 394.8 | |
|
|
Consumer | ||||||
| Reckitt Benckiser(2) | $ | 17.6 | $ | 41.5 | |
|
Nutrition | |||||||
| Stryker Corporation | $ | 22.6 | $ | 137.3 | |
|
Medical Devices | |||||||
| Thermo Fisher Scientific | $ | 42.9 | $ | 199.0 | |
|
|
Diagnostics | ||||||
| Peer Group Median | $ | 46.1 | $ | 146.9 | ||||||||||
| Abbott | $ | 42.0 | $ | 196.2 | |
|
|
|||||||
| Abbott Percentile Rank | 42nd | 63rd | ||||||||||||
| (1) | Data source: Nasdaq IR Insight database reflects most recently disclosed (as of January 31, 2025) trailing 12-month sales/revenue. The market cap reflects values on December 31, 2024. |
| (2) | Revenue/Market Cap converted to USD for companies outside the U.S. |
|
29 |
| BASIS FOR COMPENSATION DECISIONS |
Abbott and its Compensation Committee have designed a compensation program that balances short- and long-term objectives to focus our executives on actions that create value today, while building for sustainable future success. Approximately 87% of our pay is performance-based, directly tying a significant portion of executive compensation to Company performance and shareholder returns.
Our compensation program is market-based (to ensure our ability to attract and retain talented executives) and produces compensation outcomes that are performance-based (to incent the achievement of profitable growth that increases shareholder value).
COMPENSATION PROGRAM IS MARKET-BASED
All components of total direct compensation are market-based. Each year, the Compensation Committee reviews market data with the independent compensation consultant to ensure our programs are aligned and our officers are positioned appropriately relative to the market.
Base Salary
Base salary targets are initially set using the median of the peer group as a benchmark. Base salaries then vary based on market competitiveness and the officer’s experience, expertise, and performance. The average base salary of our executive officers is approximately at the market median.
Annual Incentive Plan
Annual incentive targets are initially set using the median of the peer group as a benchmark. The targets may vary based on other factors, including internal pay comparisons. Further linkage to the market is achieved by setting targets that require our officers to exceed the anticipated growth of the market in which they compete in order to achieve a target payout of their annual incentives. 2024 financial targets were set above 2023 actuals. The 2024 full year organic sales growth target was set 6.8% higher than 2023, and the actual growth was 7.1% higher than 2023. For individual calculations for each named officer, see pages 38 to 49.
Long-Term Incentive Plan (LTI)
To set annual LTI award guidelines, the Committee first reviews LTI grants made by peer companies to identify the competitive market range. Each year the guidelines are set at the appropriate level within the competitive market range based on Abbott’s relative performance, as described on pages 31 and 32. To recognize the continued growth focus of Abbott and to directly align the interests of executive officers with the interests of our shareholders, the Compensation Committee grants long-term incentive awards in the form of 50% stock options and 50% performance restricted shares. This mix of incentive awards is consistent with our peers.
| 30 | |
COMPENSATION OUTCOMES ARE PERFORMANCE-BASED
Other than base salary, which is the smallest component of our executives’ compensation, all remaining components of Total Direct Compensation (i.e., annual incentive, performance-based restricted stock awards, and stock options) are aligned with individual, business segment and Company performance.
Annual Incentive Plan
Payouts are determined based upon performance relative to annual goals and are capped at 200% of each participant’s target incentive amount. The following formula summarizes the annual incentive payout process for officers.
For example:
| BASE SALARY | BONUS TARGET % | TOTAL GOAL SCORE | AWARD PAYOUT | |||
| $525,000 | x | 90% | x | 95% | = | $448,875 |
The annual incentive plan is formula driven based on financial, strategic, talent and succession results. Officer financial goals are based on adjusted financial measures that reflect the true results of our ongoing operations and are set based on the expected market growth of the businesses in the markets in which we compete.
Long-Term Incentive Plan
Abbott’s process to determine long-term incentive awards is based on both Company and individual performance. Guidelines are set based on the relative performance of the Company compared to peers. These guidelines are adjusted, either up or down, based on individual officer performance over the prior three years. Performance restricted shares vest only if performance achieves expectations over the following three years, and stock options provide value only through share price appreciation. In contrast, most other companies reflect performance solely at the Company level through future relative TSR. Abbott’s process is much more rigorous, reflecting both Company and individual performance over a longer period.
The Committee positions LTI award guidelines relative to the market by comparing Abbott’s 1-, 3- and 5-year TSR performance against our peers. This review is part of our robust governance process, which continues to directly align our executive pay with company performance in the best interest of Abbott’s stakeholders.
For example, guidelines for grants made in February 2024 were set at the 50th percentile of our peer group, reflecting Abbott’s strong sustainable performance which resulted in total shareholder return (TSR) above the peer median on both a 5- and 1-year basis. This process has ensured close alignment of LTI grant guidelines and relative Company performance across multiple performance years, as summarized in the graphic below.
STEP 1: Link to Company Performance Compare Abbott’s TSR performance against our peer group, consider 1-, 3- and 5-year TSR to evaluate sustained performance across multiple performance periods  |
STEP 2: Link to Market Position LTI guideline value relative to peer group |
STEP 3: Link to Individual Performance Adjust for individual performance | ||||||
| Performance Period End |
1-year relative TSR Percentile |
3-year relative TSR Percentile |
5-Year Relative TSR Percentile |
Award Year |
LTI
Guideline Percentile |
LTI Award guideline adjusted up or down based on individual officer’s sustained 3-year contributions to: ● Sales and market share growth ● Margin ● Strategic metrics | ||
| 2023 | 74th | 42nd | 63rd | 2024 | 50th | |||
| 2022 | 24th | 82nd | 82nd | 2023 | 60th | |||
| 2021 | 82nd | 82nd | 88th | 2022 | 75th | |||
| 2020 | 82nd | 82nd | 82nd | 2021 | 75th | |||
| 2019 | 25th | 100th | 75th | 2020 | 60th | |||
|
31 |
The recommendation for each officer starts with the Company LTI award guideline (based on relative TSR performance and market data as described above) for the officer’s position and is adjusted based upon assessment of their sustained contributions over the last three years. Contribution scores are determined based upon performance relative to annual goals that are set at the beginning of each year and scored at the end of the year as reflected on pages 38 to 49, and are totaled and used to adjust each officer’s award guideline. Final awards may be increased or decreased based on the long-term impact each individual officer had on the organization. For example:
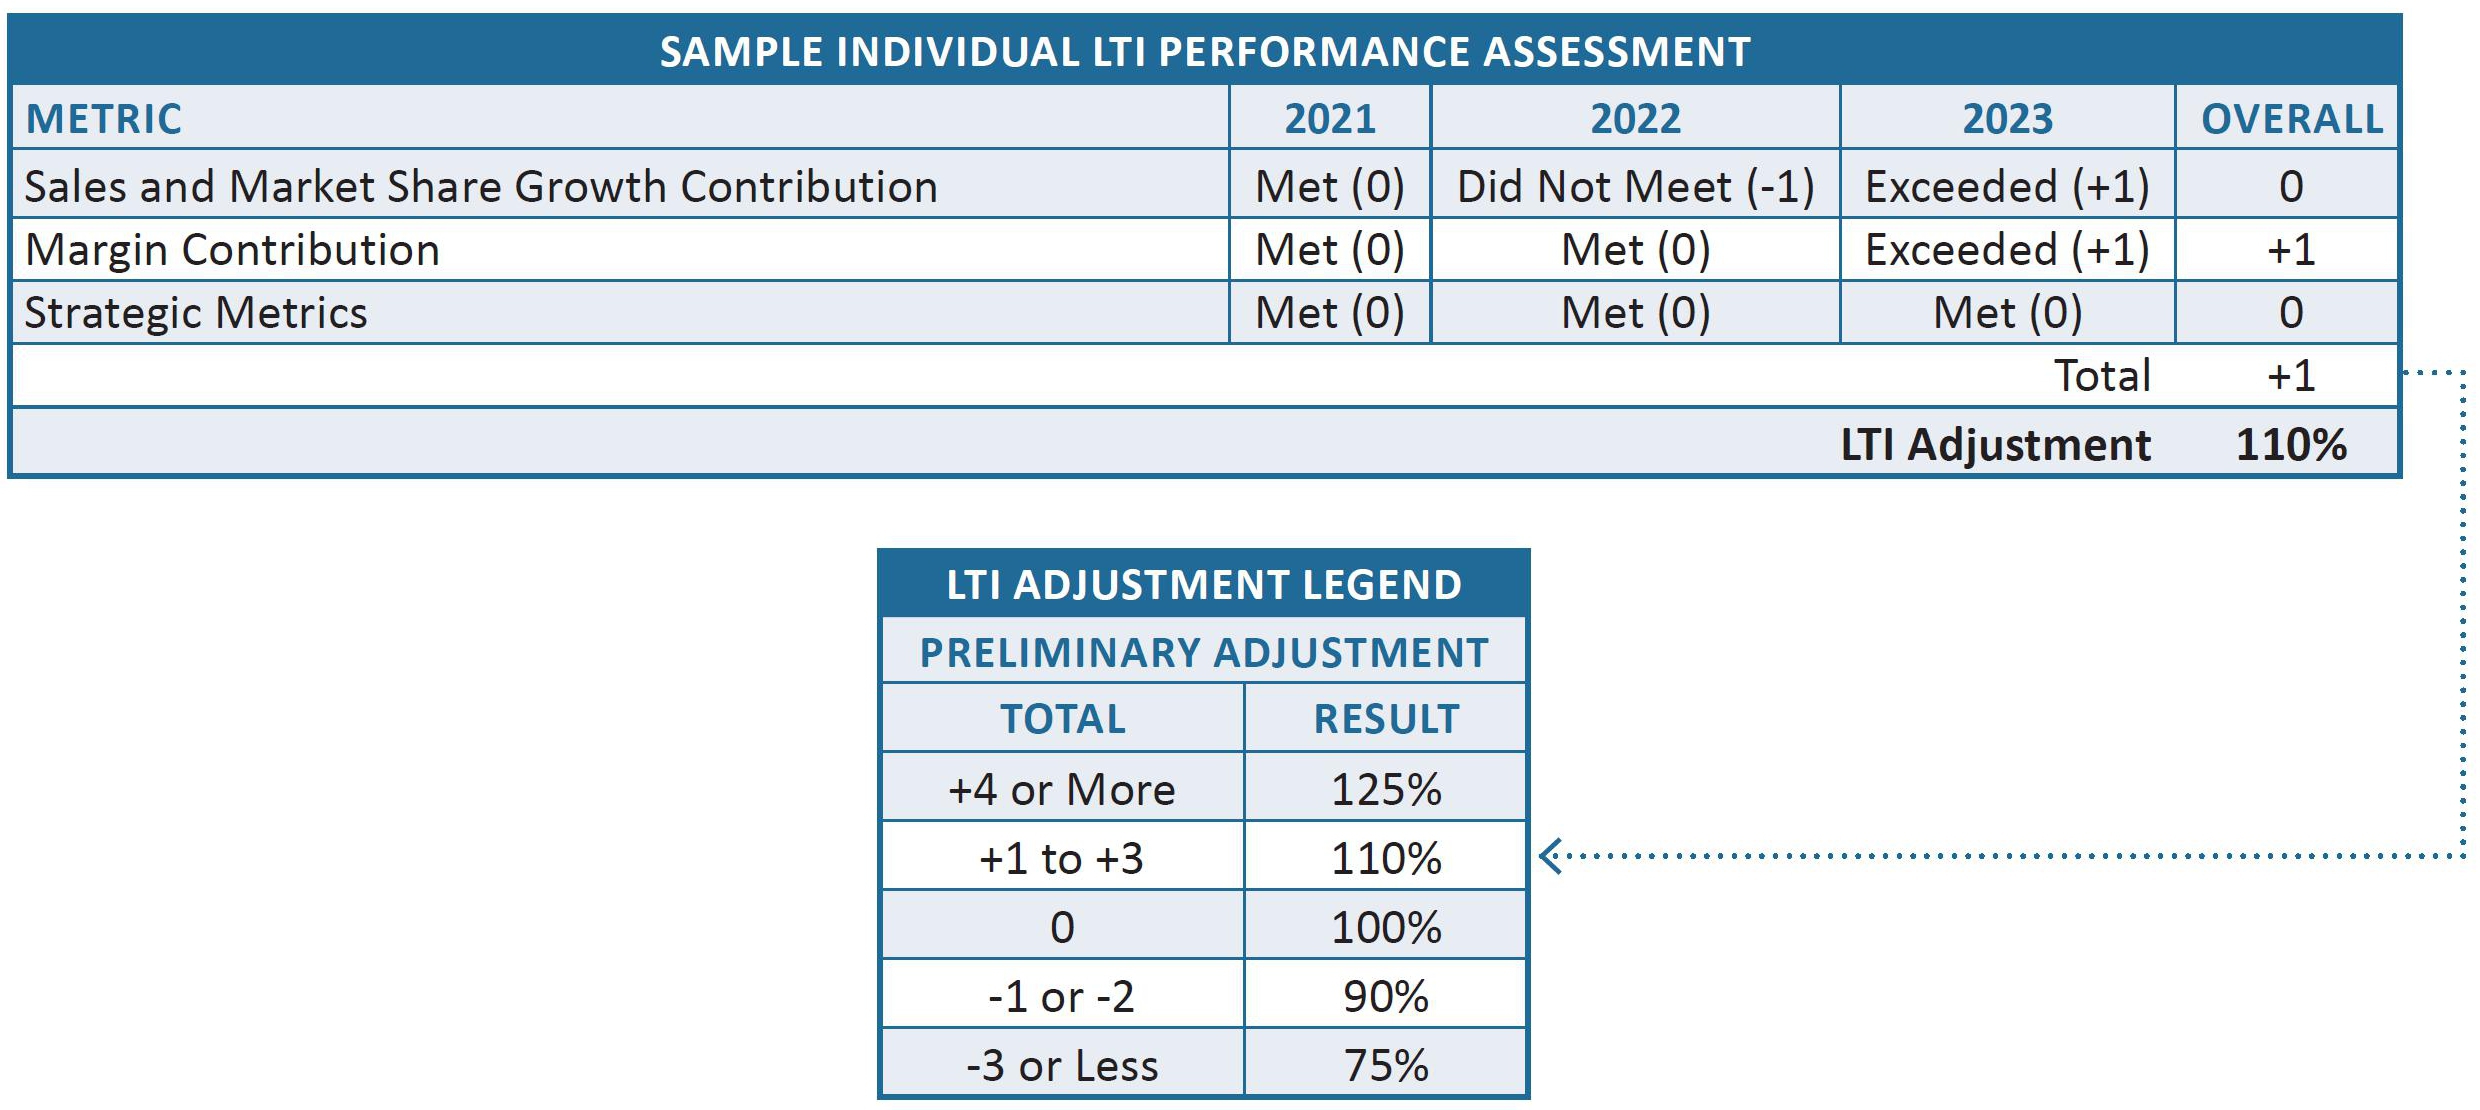
Awards granted in 2024 continue to produce strong differentiation, resulting in award adjustments that ranged from 90% to 125% of award guidelines based on individual performance measured over the three-year period ending in 2023. For individual calculations for each named officer, see pages 38 to 49.
Since stock options realize value only through share price appreciation, the value realized upon the exercise of vested stock options directly aligns the compensation earned with the value shareholders received over the same period. Options are also aligned with shareholder value through the impact of relative TSR in determining the LTI award guidelines.
Performance restricted shares are granted based both on company and individual performance and are re-earned and vest one-third each year only if the Adjusted Return on Equity (ROE) performance target is achieved. Vesting is absolute—either 100% or 0%. There is no partial vesting if the target is missed and no additional vesting upside if the Company over-performs. Our approach is fully transparent regarding the number of performance awards our executive officers stand to receive. Additionally, the Committee believes Adjusted ROE is the appropriate performance measure for vesting because ROE measures how much profit the Company generates over the long-term with the capital that shareholders have invested and is a measure reflecting deployment of capital or capital allocation.
| 32 | |
The Adjusted ROE vesting target to determine future vesting is 15%, reflecting a 50% increase since the separation of Abbott and AbbVie in 2013. Prior to the separation of Abbott and AbbVie, the AbbVie business accounted for the majority (65%) of Abbott’s adjusted net income. However, at the separation of AbbVie, Abbott retained the majority (90%) of the equity. While Abbott’s ROE was disproportionally lower following the AbbVie separation, shareholders that retained both their Abbott and AbbVie shares over the past twelve years since the AbbVie separation would have seen a 344% appreciation in their holdings. |
Impact of Abbott/
|
It is important to note that the amounts shown in the Summary Compensation Table reflect the annual bonus for 2024 performance, but the LTI awards shown are for performance through 2023. More information on the grants made for performance through 2024 will be available in the 2026 proxy.
COMPENSATION PROGRAM IS DIRECTLY LINKED TO BUSINESS STRATEGY
Our compensation program is also linked directly to our business strategy, to ensure that officers are focused on those activities that drive our business strategy and create value for shareholders while maintaining the infrastructure necessary to appropriately drive quality and compliance within the organization. These principles are core to our leadership covenant, which is considered the minimum requirement of being an officer at Abbott. Any officer who does not fulfill the covenant can receive a reduction of up to 100% of their annual incentive and/or long-term incentive awards.
The Board conducts an annual in-depth review of the long-term strategy and areas of focus for Abbott and its businesses. The Board also works with management throughout the year to review and discuss the strategic planning, including operating and financial plans, strategic business priorities and initiatives, and key risks and opportunities. These reviews include discussions on matters such as global talent management and succession planning, global market dynamics, changes in regulatory and competitive landscapes, supply chain initiatives and sustainability programs, as well as significant corporate actions such as acquisitions and capital expenditures.
|
33 |
The Board monitors management’s strategy execution, receiving regular updates to confirm that activities align with such strategies and that progress is made toward strategic objectives.
The table below explains the strategic link of the key metrics used in our annual and long-term incentive plans.
| EVALUATION OF PERFORMANCE | |
| METRIC | STRATEGIC LINK |
| Our annual incentive plan is aligned to the following drivers of shareholder value: | |
| Sales | Measures Abbott’s ability to compete effectively in the markets in which we participate and focuses management on achieving strong top-line growth, consistent with our business strategy. |
| Diluted EPS | Measures Abbott’s ability to deliver profitable growth, contributing to strong shareholder returns. |
| Return on Assets | Measures profitability and how effectively Company assets are used to generate profit. |
| Free Cash Flow | Recognizes the importance of generating cash to fund ongoing investments in our business and to pay down debt, pay dividends, and fund investments outside of capital expenditures. |
| Gross Margin | Measures Abbott’s profit after subtracting the cost of manufacturing and distributing our products. |
| Our long-term incentive plan relies on the following Company metrics, and 3-year sustained individual performance metrics, to determine award value: | |
| Total Shareholder Return | Measures Abbott’s stock and dividend performance against our peer group. Used to position LTI award guidelines relative to the market. |
| 3-year LTI Contribution Metrics | Measures how each officer has performed relative to their sales, margin, and strategic metrics. Used to adjust LTI award guidelines to reflect individual performance. |
| Return on Equity | Measures how much profit Abbott generates over the long-term with the capital that shareholders have invested. Used to determine if performance-based restricted stock awards vest. |
Officer financial goals are set and assessed based on adjusted measures that the Committee believes more accurately reflect the results of our ongoing operations. We make certain adjustments for specified items, whether favorable or unfavorable, that are unusual or unpredictable, such as cost reduction initiatives, restructuring programs, integration activities and other business acquisition-related costs, and the impact of significant tax changes. We also exclude intangible amortization expense to provide greater visibility on the results of operations excluding these costs, similar to how Abbott’s management internally assesses performance.
The Committee believes these adjusted measures provide a more stable assessment of Abbott’s core business and encourage decision-making that considers long-term value. They also align compensation goals with the financial guidance we communicate to investors, which is also based on adjusted measures.
| 34 | |
COMPENSATION LINK TO SUSTAINABILITY
Our leadership covenant specifically states that senior leaders are accountable for the achievement of Abbott’s 2030 Sustainability Plan.
The sustainability plan is integrated into our business plans, financial planning processes and existing governance structures. Each senior manager is responsible for taking actions in their organization that help achieve our targeted priorities regarding:
Making access and affordability core to new product innovation
We continued to incorporate our Innovate for Access and Affordability Design Principles into our R&D process across all businesses. These principles include 1) Design for broader reach and equity with an innovation portfolio that reaches more people, including new geographies and communities with limited access to care, 2) Design for access to identify and overcome barriers to access and adoption, prioritizing inclusive design as well as manufacturing, distribution and technology strategies to reduce costs across the value chain, and 3) Design to optimize reach and value across four factors: people reached, consumer benefit, business and societal value. Design innovations that improve access can be seen in action in our products, including adding a cancer screening tool for detecting high-risk human papillomavirus (HPV) infections to the Alinity m family of diagnostic assays, helping support patient care and streamline HPV testing; obtaining U.S. FDA approval for the Proclaim XR spinal cord stimulation (SCS) system to treat painful diabetic peripheral neuropathy, a debilitating complication of diabetes; and announcing an agreement with Spain-based global biotech leader mAbxience that will provide new access to cutting-edge biosimilars to more people in key emerging markets.
Transforming care for chronic disease, malnutrition, and infectious diseases
We released results from our Healthy Food Rx study in Stockton, California, which showed clinically significant benefits of home-delivered healthy food boxes for people with diabetes, as well as significant improvements in diabetes self-management and overall diet and food security at 12 months. We also delivered community-centric programming with Erie Family Health Centers, RUSH University Medical Center, the Alive Faith Network in Illinois, and the University of Minnesota Community-University Health Care Center in Minnesota that reached nearly 16,000 people through health screenings, education, and care provision. We further expanded the geographic footprint of the Abbott Pandemic Defense Coalition, a first-of-its-kind global scientific and public health partnership dedicated to the early detection of, and rapid response to, future pandemic threats. The coalition is designed with a comprehensive approach to containing emerging threats, leveraging the expertise of global centers of excellence in laboratory testing, genetic sequencing, and public health research. The coalition identified six new viruses and developed 13 new prototype assays.
Advancing health equity through partnership
Through social investing and Abbott Fund programs, we’ve partnered to provide decentralized community-centric health services and programming to underserved communities, helping more than 1.2 million people globally access healthcare close to where they live.
For nearly 25 years, Abbott has been partnering with the Tanzanian government to improve health and healthcare systems in Tanzania. Since 2010, we have provided emergency care services to nearly 1.3 million patients there. In the last decade, we have supported the training of nearly 6,000 emergency healthcare workers who are providing care in Tanzania. In 2023, we also supported the ongoing training of more than 3,300 health workers, including doctors, surgeons, nurses, and social workers.
|
35 |
As part of our ongoing work to advance health equity, we also focused efforts on research infrastructure, continued training of diverse clinical research personnel, and improved diversity within Abbott’s own clinical trials. Through a five-year plan, Abbott is working alongside the Institute for Health Equity at Norton Healthcare to build research program models that can be implemented by historically Black colleges and universities (HBCUs) and clinics serving underrepresented communities. In partnership with the National Association of Community Health Centers, Abbott has been delivering a first-of-its-kind Innovation Incubator health center program, partnering with eight health centers to build their capacity and design new solutions to digital and health literacy challenges and sharing learnings to a network of more than 1,400 organizations.
Protecting a healthy environment
Every year we establish and advance projects to sustainably reduce carbon emissions, expand use of renewable energy, manage water use, reduce the impact of our packaging and minimize waste.
Our Scopes 1, 2, and 3 targets were approved by the Science Based Targets initiative (SBTi) in September 2022. Additionally, we completed an assessment to understand our key suppliers’ existing carbon management efforts and their impact on Scope 3 emissions. By the end of 2023, Abbott reduced absolute Scope 1 and 2 emissions by 7%, compared to the 2018 baseline. Our Scope 3 goal calls for suppliers representing two of our largest categories – purchased goods and services, and upstream transportation and distribution – to have science-based targets by 2026. Approximately 33% of our suppliers by emissions covering purchased goods and services and upstream transportation and distribution have science-based targets.
We continue to make progress on water, waste and packaging reduction initiatives. Six of our high-water-impact manufacturing sites that operate in areas of water stress have achieved Alliance for Water Stewardship (AWS) certification. In 2023, two additional manufacturing facilities received Zero Waste-to-Landfill certification. This brings our total Zero Waste-to-Landfill sites to 53 facilities certified since our internal program began in 2012. Lastly, approximately 30 million pounds of packaging were impacted through sustainable design programs in 2020–2023. This includes more than 1.6 million pounds of packaging transitioned to more circular options annually, and more than 28 million pounds of material eliminated or reduced annually.
Building the diverse, innovative workforce of tomorrow
We provide differentiated benefits, extraordinary development opportunities and a powerful common purpose to attract and retain the workforce we need for today and to continue to innovate for the future.
We start early, with highly rated internships that allow us to attract talent that otherwise might not consider a career in STEM. We remain focused on developing future leaders through our mentoring and sponsorship programs that support internal development and succession planning. In 2023 we created more than 304,000 development and job opportunities for current and future employees. This brings our total to more than 813,700 since the launch of our 2030 Plan. In just 4 years, we have nearly reached our initial goal of 1 million. Consequently, we have set a new goal of 2 million. Additionally, we created more than 31,000 STEM opportunities globally for young people in 2023, bringing our total to more than 103,000 since the launch of our 2030 Plan, exceeding our original goal of 100,000, which we have since increased to 200,000.
| 36 | |
Our market-leading benefits focus on those areas that have real impact for our employees. We were the first company to help U.S. employees save for retirement while repaying student loans through our Freedom 2 Save program, which was codified by the federal government through the Secure 2.0 Act. Nearly $2.2 million total Freedom 2 Save employer contributions to participant retirement accounts were made in 2023, bringing our total to over $7.7 million total employer contributions since the program’s inception in 2019. This program was included by Fortune magazine in its 2023 “Change the World” list, which recognizes companies that deliver shared value by making an important social or environmental impact through their core business strategies and operations. Abbott was also recognized by U.S. Veterans Magazine in 2024 as a “Top Veteran-Friendly Company” for our commitment to inclusion and equal opportunities for veterans.
Responsibly connecting data, technology, and care
We are dedicated to being a trusted healthcare partner and advocate for responsible data collection, access and insights. In 2023, we developed an executive-level cross-functional Data Use and Ethics Board to establish data and artificial intelligence (AI) guiding principles, provide direction on strategic focus for data capabilities, and sponsor the creation of, or enhancements to, policies and standards around responsible data use. Abbott’s five key principles for ethical use of AI outline our commitment to maintain the foundation of trust we have built with our customers, employees and business partners by being Responsible, Safe, Transparent, Fair and Impactful in our use of AI. Additionally, we improved our customer cybersecurity portal with more automation and enhanced access, search, and notification capabilities to provide healthcare delivery organizations direct access to key cybersecurity information on Abbott products.
Creating a resilient, diverse, and responsible supply chain
We are committed to maintaining a high-quality, sustainable, and resilient supply chain to deliver products that millions of people depend on worldwide. We work with approximately 59,000 suppliers in more than 150 countries; we have a robust supplier selection process and published supplier guidelines. In 2023 Abbott committed almost $13 million of the $37.5 million pledged in growth capital and small business loans to diverse small businesses through our collaboration with Local Initiatives Support Corporation (LISC). Additionally, Abbott was inducted into the Billion Dollar Roundtable, an organization for corporations that spend more than 1 billion with diverse suppliers annually.
PAY DECISIONS FOR NAMED EXECUTIVE OFFICERS
The following pages detail the goals and metrics used to determine each named officer’s payout under our annual and long-term incentive plans. For some goals, the target is not disclosed for competitive reasons. It is important to note that the amounts shown in the Summary Compensation Table reflect the annual bonus for 2024 performance, but the LTI awards shown are for performance through 2023. More information on the grants made for performance through 2024 will be available in the 2026 proxy.
|
37 |
NAMED EXECUTIVE OFFICER COMPENSATION DECISIONS
 |
ROBERT B. FORD Chairman of the Board and Chief Executive Officer |
Base Salary
Mr. Ford’s annual base salary of $1,500,000 did not change in 2024.
Annual Incentive Plan
Mr. Ford’s target bonus of 175% was not changed in 2024. Based on performance in 2024, Mr. Ford received a bonus in February 2025 which was calculated as follows:
| GOAL | 2023 RESULTS ACHIEVED |
GOAL WEIGHT |
2024 GOAL MEASUREMENT | 2024 RESULTS ACHIEVED |
GOAL SCORE | ||
| THRESHOLD | TARGET | MAXIMUM | |||||
| FINANCIAL METRICS(1) | |||||||
| Adjusted Sales(2) | $40.44B | 25% | $41.988B | $42.288B | $42.588B | $42.294B | 25.25% |
| Adjusted Diluted EPS | $4.44 | 25% | $4.50 | $4.60 | $4.70 | $4.67 | 33.75% |
| Adjusted ROA | 13.7% | 10% | 13.7% | 13.9% | 14.3% | 14.3% | 15.0% |
| Free Cash Flow | $5.1B | 10% | $5.1B | $5.3B | $5.5B | $6.4B | 15.0% |
| STRATEGIC METRICS | |||||||
| Gross Margin Profile(3) | 10% | 55.6% | 56.2% | 56.8% | 56.2% | 10.0% | |
| Goal (10% weight)(4): Enhance Abbott portfolio | Not Achieved |
0% | |||||
| HUMAN CAPITAL METRICS | |||||||
| Goal (10% weight): Meet talent and succession planning targets. | Achieved | 10.0% | |||||
| Total | 109.0% | ||||||
| (1) | Adjusted Sales exclude the impact of foreign exchange on actual sales relative to the goal target. Adjusted Diluted EPS is diluted earnings per common share from continuing operations excluding specified items, such as intangible amortization expense and various other costs including expenses related to restructuring actions or business acquisitions. Adjusted Return on Assets (ROA) reflects earnings from continuing operations, excluding interest expense and specified items. Adjusted ROA also reflects total assets less current liabilities excluding short-term borrowings. Free Cash Flow equals Operating Cash Flow less acquisitions of property and equipment. |
| (2) | Set based on expected market growth of the businesses and markets in which we compete. To achieve target payout, market share must increase. |
| (3) | Gross Margin Profile excludes specified items, such as intangible amortization and restructuring and cost reduction initiatives. |
| (4) | Target not disclosed for competitive reasons. |
| BASE SALARY | BONUS TARGET % | TOTAL GOAL SCORE | AWARD PAYOUT | |||
| $1,500,000 | × | 175% | × | 109.0% | = | $2,861,250 |
| 38 | |
Long-Term Incentives
Based on the Committee’s review of Abbott and individual performance through 2023, Mr. Ford received an LTI award in February 2024 with a value of $16,454,900, which was 110% of the market value equity award for a CEO in Abbott’s peer group. This award was granted 50% in stock options(1) and 50% in performance restricted shares(2).
| LTI
AWARD GUIDELINE |
LTI ADJUSTMENT | AWARD ALLOCATION | AWARD VALUE | |||
| $14,959,000 | × | 110% | × | 50% Stock Options(1) | = | $8,227,450 |
| 50% Performance Restricted Shares(2) | $8,227,450 | |||||
| Total | $16,454,900 |
| INDIVIDUAL LTI PERFORMANCE ASSESSMENT | ||||
| METRIC | 2021 | 2022 | 2023 | OVERALL |
| Sales and Market Share Growth Contribution | Exceeded (+1) | Met (0) | Exceeded (+1) | +2 |
| Margin Contribution | Exceeded (+1) | Met (0) | Exceeded (+1) | +2 |
| Strategic Metrics | Did Not Meet (-1) | Did Not Meet (-1) | Met (0) | -2 |
| Total | +2 | |||
| LTI Adjustment | 110% | |||
| LTI ADJUSTMENT LEGEND | |
| TOTAL | RESULT |
| +4 or More | 125% |
| +1 to +3 | 110% |
| 0 | 100% |
| -1 or -2 | 90% |
| -3 or Less | 75% |
| (1) | Stock options realize value only through share price appreciation. |
| (2) | Performance restricted shares vest only if the 14% Adjusted Return on Equity (ROE) performance target is achieved. |
|
39 |
 |
PHILIP P. BOUDREAU Executive Vice President, Finance and Chief Financial Officer |
Mr. Boudreau previously served as Senior Vice President, Finance and Chief Financial Officer. Mr. Boudreau was appointed to the role of Executive Vice President, Finance and Chief Financial Officer effective July 1, 2024.
Base Salary
Mr. Boudreau’s annual base salary was increased to $950,000 in March 2024.
Annual Incentive Plan
Mr. Boudreau’s target bonus was increased to 115% of base salary during 2024 in connection with his promotion to Executive Vice President, Finance and Chief Financial Officer. Based on performance in 2024, Mr. Boudreau received a bonus in February 2025 which was calculated as follows:
| GOAL | 2023 RESULTS ACHIEVED |
GOAL WEIGHT |
2024 GOAL MEASUREMENT | 2024 RESULTS ACHIEVED |
GOAL SCORE | ||
| THRESHOLD | TARGET | MAXIMUM | |||||
| FINANCIAL METRICS(1) | |||||||
| Adjusted Sales(2) | $40.44B | 10% | $41.988B | $42.288B | $42.588B | $42.294B | 10.1% |
| Adjusted Diluted EPS | $4.44 | 20% | $4.50 | $4.60 | $4.70 | $4.67 | 27.0% |
| Free Cash Flow | $5.1B | 10% | $5.1B | $5.3B | $5.5B | $6.4B | 15.0% |
| Gross Margin Profile | — | 10% | 55.6% | 56.2% | 56.8% | 56.2% | 10.0% |
| STRATEGIC METRICS(3) | |||||||
Goal (12.5% weight): Execute milestones related to new regulatory
and financial disclosure requirements. |
12.5% | ||||||
Goal (5.0% weight): Develop and execute plans to manage currency
and economic risks. |
5.0% | ||||||
Goal (7.5% weight): Implement key financial systems in select
countries. |
7.5% | ||||||
Goal (10.0% weight): Achieve key financial return metrics. |
10.0% | ||||||
| HUMAN CAPITAL METRICS | |||||||
| Goal
(15% weight): Meet talent and succession planning targets. Result: Achieved |
15.0% | ||||||
| Total | 112.1% | ||||||
| (1) | Adjusted Sales and exclude the impact of foreign exchange on actual sales relative to the goal target. Adjusted Diluted EPS is diluted earnings per common share from continuing operations excluding specified items. Free Cash Flow equals Operating Cash Flow less acquisitions of property and equipment. Gross Margin Profile excludes specified items, such as intangible amortization, restructuring and cost reduction initiatives. |
| (2) | Set based on expected market growth of the businesses and markets in which we compete. To achieve target payout, market share must increase. |
| (3) | Target not disclosed for competitive reasons. |
| 40 | |
| BASE SALARY | BONUS TARGET % | TOTAL GOAL SCORE | AWARD PAYOUT | |||
| $950,000 | × | 115% | × | 112.1% | = | $1,224,700 |
Long-Term Incentives
Based on the Committee’s review of Abbott and individual performance through 2023, Mr. Boudreau received an LTI award in February 2024 with a value of $5,386,700, which was equal to 110% of the market value equity award for a CFO in Abbott’s peer group. Additional calculation details are as follows:
| LTI
AWARD GUIDELINE |
LTI ADJUSTMENT | AWARD ALLOCATION | AWARD VALUE | |||
| $4,897,000 | × | 110% | × | 50% Stock Options(1) | = | $2,693,350 |
| 50% Performance Restricted Shares(2) | $2,693,350 | |||||
| Total | $5,386,700 |
| INDIVIDUAL LTI PERFORMANCE ASSESSMENT | ||||
| METRIC | 2021 | 2022 | 2023 | OVERALL |
| Sales and Market Share Growth Contribution | Exceeded (+1) | Met (0) | Exceeded (+1) | +2 |
| Margin Contribution | Exceeded (+1) | Met (0) | Exceeded (+1) | +2 |
| Strategic Metrics | Did Not Meet (-1) | Did Not Meet (-1) | Met (0) | -2 |
| Total | +2 | |||
| LTI Adjustment | 110% | |||
| LTI ADJUSTMENT LEGEND | |
| TOTAL | RESULT |
| +4 or More | 125% |
| +1 to +3 | 110% |
| 0 | 100% |
| -1 or -2 | 90% |
| -3 or Less | 75% |
| (1) | Stock options realize value only through share price appreciation. |
| (2) | Performance restricted shares vest only if the 14% Adjusted Return on Equity (ROE) performance target is achieved. |
|
41 |
 |
HUBERT L. ALLEN Executive Vice President, General Counsel and Secretary |
Base Salary
Mr. Allen’s annual base salary was increased to $930,000 in March 2024.
Annual Incentive Plan
Mr. Allen’s target bonus of 105% was not changed in 2024. Based on performance in 2024, Mr. Allen received a bonus in February 2025 which was calculated as follows:
| GOAL | 2023 RESULTS ACHIEVED |
GOAL WEIGHT |
2024 GOAL MEASUREMENT | 2024 RESULTS ACHIEVED |
GOAL SCORE | ||
| THRESHOLD | TARGET | MAXIMUM | |||||
| FINANCIAL METRICS(1) | |||||||
| Adjusted Sales(2) | $40.44B | 10% | $41.988B | $42.288B | $42.588B | $42.294B | 10.1% |
| Adjusted Diluted EPS | $4.44 | 20% | $4.50 | $4.60 | $4.70 | $4.67 | 27.0% |
| Free Cash Flow | $5.1B | 10% | $5.1B | $5.3B | $5.5B | $6.4B | 15.0% |
| Gross Margin Profile | — | 10% | 55.6% | 56.2% | 56.8% | 56.2% | 10.0% |
| Other Financial Returns(3) | Achieved | 10% | Target | Target | Target | Achieved | 10.0% |
| STRATEGIC METRICS(3) | |||||||
Goal (25% weight): Resolve certain key litigation matters and
investigations. |
25.0% | ||||||
| HUMAN CAPITAL METRICS | |||||||
| Goal
(15% weight): Meet talent and succession planning targets. Result: Achieved |
15.0% | ||||||
| Total | 112.1% | ||||||
| (1) | Adjusted Sales and exclude the impact of foreign exchange on actual sales relative to the goal target. Adjusted Diluted EPS is diluted earnings per common share from continuing operations excluding specified items. Free Cash Flow equals Operating Cash Flow less acquisitions of property and equipment. Gross Margin Profile excludes specified items, such as intangible amortization, restructuring and cost reduction initiatives. |
| (2) | Set based on expected market growth of the businesses and markets in which we compete. To achieve target payout, market share must increase. |
| (3) | Target not disclosed for competitive reasons. |
| BASE SALARY | BONUS TARGET % | TOTAL GOAL SCORE | AWARD PAYOUT | |||
| $930,000 | × | 105% | × | 112.1% | = | $1,094,700 |
| 42 | |
Long-Term Incentives
Based on the Committee’s review of Abbott and individual performance through 2023, Mr. Allen received an LTI award in February 2024 with a value of $4,191,250, which was equal to 125% of his LTI award guideline. Additional calculation details are as follows:
| LTI
AWARD GUIDELINE |
LTI ADJUSTMENT | AWARD ALLOCATION | AWARD VALUE | |||
| $3,353,000 | × | 125% | × | 50% Stock Options(1) | = | $2,095,625 |
| 50% Performance Restricted Shares(2) | $2,095,625 | |||||
| Total | $4,191,250 |
| INDIVIDUAL LTI PERFORMANCE ASSESSMENT | ||||
| METRIC | 2021 | 2022 | 2023 | OVERALL |
| Sales and Market Share Growth Contribution | Exceeded (+1) | Met (0) | Exceeded (+1) | +2 |
| Margin Contribution | Exceeded (+1) | Met (0) | Exceeded (+1) | +2 |
| Strategic Metrics | Met (0) | Met (0) | Met (0) | 0 |
| Total | +4 | |||
| LTI Adjustment | 125% | |||
| LTI ADJUSTMENT LEGEND | |
| TOTAL | RESULT |
| +4 or More | 125% |
| +1 to +3 | 110% |
| 0 | 100% |
| -1 or -2 | 90% |
| -3 or Less | 75% |
| (1) | Stock options realize value only through share price appreciation. |
| (2) | Performance restricted shares vest only if the 14% Adjusted Return on Equity (ROE) performance target is achieved. |
|
43 |
 |
LISA D. EARNHARDT Executive Vice President and Group President, Medical Devices |
Base Salary
Ms. Earnhardt’s annual base salary was increased to $900,000 in March 2024.
Annual Incentive Plan
Ms. Earnhardt’s target bonus of 115% was not changed in 2024. Based on performance in 2024, Ms. Earnhardt received a bonus in February 2025 which was calculated as follows:
| GOAL | 2023 RESULTS ACHIEVED |
GOAL WEIGHT |
2024 GOAL MEASUREMENT | 2024 RESULTS ACHIEVED |
GOAL SCORE | ||
| THRESHOLD | TARGET | MAXIMUM | |||||
| FINANCIAL METRICS(1) | |||||||
| Adjusted Division Net Sales(2) | $16.99B | 20% | $18.79B | $19.11B | $19.34B | $19.29B | 27.8% |
| Adjusted Division Margin(3) | 101.10%
of Target |
20% | Target | Target | 102.14%
of Target |
101.4%
of Target |
26.4% |
| Adjusted Division Gross Margin(3) | 99.4%
of Target |
15% | 99.4%
of Target |
Target | 103.0%
of Target |
99.8%
of Target |
13.2% |
| Market Share(3) | Achieved | 10% | Target | Target | Target | Achieved | 10.0% |
| Adjusted Division Operating Cash Flow(3) | — | 5% | Target | Target | 102.1% of Target |
100.7%
of Target |
5.8% |
| Cash Conversion Cycle(3) | Not Achieved |
5% | 5
days over Target |
Target | Target | Achieved | 5.0% |
| STRATEGIC METRICS(3) | |||||||
Goal (15% weight): Execute strategic financial contribution
related to product approvals and production expansion. |
22.5% | ||||||
| HUMAN CAPITAL METRICS | |||||||
| Goal
(10% weight): Meet talent and succession planning targets. Result: Achieved |
10.0% | ||||||
| Total | 120.7% | ||||||
| (1) | Adjusted Division Net Sales exclude the impact of foreign exchange on actual sales relative to the goal target. Adjusted Division Margin and Adjusted Division Gross Margin exclude the impact of foreign exchange and other non-recurring items on actual division margin and gross margin relative to the respective goal target. Adjusted Division Operating Cash Flow reflects pre-tax operating cash flow and excludes the impact of foreign exchange. |
| (2) | Set based on expected market growth of the businesses and markets in which we compete. To achieve target payout, market share must increase. |
| (3) | Target not disclosed for competitive reasons. |
| BASE SALARY | BONUS TARGET % | TOTAL GOAL SCORE | AWARD PAYOUT | |||
| $900,000 | × | 115% | × | 120.7% | = | $1,249,200 |
| 44 | |
Long-Term Incentives
Based on the Committee’s review of Abbott and individual performance through 2023, Ms. Earnhardt received an LTI award in February 2024 with a value of $4,033,700, which was equal to 110% of her LTI award guideline. Additional calculation details are as follows:
| LTI
AWARD GUIDELINE |
LTI ADJUSTMENT | AWARD ALLOCATION | AWARD VALUE | |||
| $3,667,000 | × | 110% | × | 50% Stock Options(1) | = | $2,016,850 |
| 50% Performance Restricted Shares(2) | $2,016,850 | |||||
| Total | $4,033,700 |
| INDIVIDUAL LTI PERFORMANCE ASSESSMENT | ||||
| METRIC | 2021 | 2022 | 2023 | OVERALL |
| Sales and Market Share Growth Contribution | Met (0) | Met (0) | Exceeded (+1) | +1 |
| Margin Contribution | Met (0) | Met (0) | Exceeded (+1) | +1 |
| Strategic Metrics | Met (0) | Met (0) | Met (0) | 0 |
| Total | +2 | |||
| LTI Adjustment | 110% | |||
| LTI ADJUSTMENT LEGEND | |
| TOTAL | RESULT |
| +4 or More | 125% |
| +1 to +3 | 110% |
| 0 | 100% |
| -1 or -2 | 90% |
| -3 or Less | 75% |
| (1) | Stock options realize value only through share price appreciation. |
| (2) | Performance restricted shares vest only if the 14% Adjusted Return on Equity (ROE) performance target is achieved. |
|
45 |
 |
DANIEL G. SALVADORI Executive Vice President and Group President, Established Pharmaceuticals and Nutritional Products |
Base Salary
Mr. Salvadori’s annual base salary was increased to $900,000 in March 2024.
Annual Incentive Plan
Mr. Salvadori’s target bonus of 115% was not changed in 2024. Based on performance in 2024, Mr. Salvadori received a bonus in February 2025 which was calculated as follows:
| GOAL | 2023 RESULTS ACHIEVED |
GOAL WEIGHT |
2024 GOAL MEASUREMENT | 2024 RESULTS ACHIEVED |
GOAL SCORE | ||
| THRESHOLD | TARGET | MAXIMUM | |||||
| FINANCIAL METRICS(1) | |||||||
| Adjusted Division Net Sales(2) | $13.28B | 20% | $13.84B | $14.12B | $14.41B | $13.65 | 0% |
| Adjusted Division Margin(3) | Above Target | 20% | Target | Target | 105.3% of Target |
101.5% of Target |
22.8% |
| Adjusted Division Gross Margin(3) | Mostly Achieved |
15% | 99.4% of Target |
Target | 104.1% of Target |
100.4% of Target |
15.75% |
| Market Share(3) | Achieved | 10% | Target | Target | Target | Achieved | 10.0% |
| Adjusted Division Operating Cash Flow(3) | — | 5% | Target | Target | 102.4% of Target |
Not Achieved |
0% |
| Cash Conversion Cycle(3) | Partially Achieved |
5% | 4 days over Target |
Target | Target | Achieved | 5% |
| STRATEGIC METRICS(3) | |||||||
|
Goal (15% weight): Complete the necessary licensing, pricing, and expansion metrics per approved plans |
19.1% | ||||||
| HUMAN CAPITAL METRICS | |||||||
| Goal (10% weight): Meet talent and succession planning targets. Result: Achieved |
10.0% | ||||||
| Total | 82.65% | ||||||
| (1) | Adjusted Division Net Sales exclude the impact of foreign exchange on actual sales relative to the goal target. Adjusted Division Margin and Adjusted Division Gross Margin excludes the impact of foreign exchange and other non-recurring items on actual division margin and gross margin relative to the respective goal target. Adjusted Division Operating Cash Flow reflects pre-tax operating cash flow and excludes the impact of foreign exchange. |
| (2) | Set based on expected market growth of the businesses and markets in which we compete. To achieve target payout, market share must increase. |
| (3) | Target not disclosed for competitive reasons. |
| BASE SALARY | BONUS TARGET % | TOTAL GOAL SCORE | AWARD PAYOUT | |||
| $900,000 | × | 115% | × | 82.65% | = | $855,400 |
| 46 | |
Long-Term Incentives
Based on the Committee’s review of Abbott and individual performance through 2023, Mr. Salvadori received an LTI award in February 2024 with a value of $3,667,000, which was equal to 100% of his LTI award guideline. Additional calculation details are as follows:
| LTI
AWARD GUIDELINE |
LTI ADJUSTMENT | AWARD ALLOCATION | AWARD VALUE | |||
| $3,667,000 | × | 100% | × | 50% Stock Options(1) | = | $1,833,500 |
| 50% Performance Restricted Shares(2) | $1,833,500 | |||||
| Total | $3,667,000 |
| INDIVIDUAL LTI PERFORMANCE ASSESSMENT | ||||
| METRIC | 2021 | 2022 | 2023 | OVERALL |
| Sales and Market Share Growth Contribution | Exceeded (+1) | Did Not Meet (-1) | Did Not Meet (-1) | -1 |
| Margin Contribution | Exceeded (+1) | Did Not Meet (-1) | Exceeded (+1) | +1 |
| Strategic Metrics | Met (0) | Did Not Meet (-1) | Exceeded (+1) | 0 |
| Total | 0 | |||
| LTI Adjustment | 100% | |||
| LTI ADJUSTMENT LEGEND | |
| TOTAL | RESULT |
| +4 or More | 125% |
| +1 to +3 | 110% |
| 0 | 100% |
| -1 or -2 | 90% |
| -3 or Less | 75% |
| (1) | Stock options realize value only through share price appreciation. |
| (2) | Performance restricted shares vest only if the 14% Adjusted Return on Equity (ROE) performance target is achieved. |
|
47 |
 |
ROBERT E. FUNCK, JR Former Executive Vice President, Finance |
Mr. Funck retired from Abbott effective July 1, 2024.
Base Salary
Mr. Funck had an annual base salary of $875,000.
Annual Incentive Plan
Mr. Funck had an annual target bonus of 115%. Based on performance through June 2024, Mr. Funck received a prorated bonus in February 2025 which was calculated as follows:
| GOAL | 2023 RESULTS ACHIEVED |
GOAL WEIGHT |
2024 GOAL MEASUREMENT | 2024 RESULTS ACHIEVED |
GOAL SCORE | ||
| THRESHOLD | TARGET | MAXIMUM | |||||
| FINANCIAL METRICS(1) | |||||||
| Adjusted Sales(2) | $40.44B | 10% | $41.988B | $42.288B | $42.588B | $42.294B | 10.1% |
| Adjusted Diluted EPS | $4.44 | 20% | $4.50 | $4.60 | $4.70 | $4.67 | 27.0% |
| Free Cash Flow | $5.1B | 10% | $5.1B | $5.3B | $5.5B | $6.4B | 15.0% |
| Gross Margin Profile | — | 10% | 55.6% | 56.2% | 56.8% | 56.2% | 10.0% |
| STRATEGIC METRICS(3) | |||||||
Goal (10% weight): Execute milestones related to capital structure
and licensing and acquisition priorities. |
10.0% | ||||||
Goal (5% weight): Develop and execute plans to manage cybersecurity
risks. |
5.0% | ||||||
Goal (7.5% weight): Develop and execute plans to manage currency
and economic risks. |
7.5% | ||||||
Goal (12.5% weight): Implement key IT infrastructure initiatives. |
12.5% | ||||||
| HUMAN CAPITAL METRICS | |||||||
| Goal
(15% weight): Meet talent and succession planning targets. Result: Achieved |
15.0% | ||||||
| Total | 112.1% | ||||||
| (1) | Adjusted Sales and exclude the impact of foreign exchange on actual sales relative to the goal target. Adjusted Diluted EPS is diluted earnings per common share from continuing operations excluding specified items. Free Cash Flow equals Operating Cash Flow less acquisitions of property and equipment. Gross Margin Profile excludes specified items, such as intangible amortization, restructuring and cost reduction initiatives. |
| (2) | Set based on expected market growth of the businesses and markets in which we compete. To achieve target payout, market share must increase. |
| (3) | Target not disclosed for competitive reasons. |
| BASE SALARY | BONUS TARGET % | TOTAL GOAL SCORE | PRORATION FACTOR | AWARD PAYOUT | ||||
| $875,000 | × | 115% | × | 112.1% | × | 50% | = | $564,000 |
| 48 | |
Long-Term Incentives
Based on the Committee’s review of Abbott and individual performance through 2023, Mr. Funck received an LTI award in February 2024 with a value of $5,736,500, which was equal to 110% of his LTI guideline. Additional calculation details are as follows:
| LTI
AWARD GUIDELINE |
LTI ADJUSTMENT | AWARD ALLOCATION | AWARD VALUE | |||
| $5,215,000 | × | 110% | × | 50% Stock Options(1) | = | $2,868,250 |
| 50% Performance Restricted Shares(2) | $2,868,250 | |||||
| Total | $5,736,500 |
| INDIVIDUAL LTI PERFORMANCE ASSESSMENT | ||||
| METRIC | 2021 | 2022 | 2023 | OVERALL |
| Sales and Market Share Growth Contribution | Exceeded (+1) | Met (0) | Exceeded (+1) | +2 |
| Margin Contribution | Exceeded (+1) | Met (0) | Exceeded (+1) | +2 |
| Strategic Metrics | Did Not Meet (-1) | Did Not Meet (-1) | Met (0) | -2 |
| Total | +2 | |||
| LTI Adjustment | 110% | |||
| LTI ADJUSTMENT LEGEND | |
| TOTAL | RESULT |
| +4 or More | 125% |
| +1 to +3 | 110% |
| 0 | 100% |
| -1 or -2 | 90% |
| -3 or Less | 75% |
| (1) | Stock options realize value only through share price appreciation. |
| (2) | Performance restricted shares vest only if the 14% Adjusted Return on Equity (ROE) performance target is achieved. |
|
49 |
BENEFITS AND PERQUISITES
Each of the benefits described below was designed to support the Company’s objective of providing a competitive total pay program. Individual benefits do not directly affect decisions regarding other benefits or pay components, except to the extent that benefits and pay components must, in aggregate, be competitive.
| BENEFITS AND PERQUISITES | DESCRIPTION | |
| Retirement Benefits | The named officers participate in Abbott-sponsored defined benefit plans: the Abbott Laboratories Annuity Retirement Plan and the Abbott Laboratories Supplemental Pension Plan. These plans are described in greater detail in the “Pension Benefits” section of the proxy. Since officers’ Supplemental Pension Plan benefits cannot be secured in a manner similar to qualified plans, which are held in trust, officers receive an annual cash payment equal to the increase in present value of their Supplemental Pension Plan benefit. Officers have the option of depositing these annual payments to an individually established grantor trust, net of tax withholdings. Deposited amounts may be credited with the difference between the officers’ actual annual trust earnings and the rate used to calculate trust funding (currently 8%) while they are employed. Amounts deposited in the individual trusts are not tax deferred. Officers do not receive tax gross ups on their grantor trusts. The manner in which the grantor trust will be distributed to an officer upon retirement from the Company generally follows the manner elected by the officer under the Annuity Retirement Plan. Should an officer (or the officer’s spouse, depending upon the pension distribution method elected by the officer under the Annuity Retirement Plan) live beyond the actuarial life expectancy age used to determine the Supplemental Pension Plan benefit and, therefore, exhaust the trust balance, the Supplemental Pension Plan benefit will be paid by the Company. | |
| Deferred Compensation | Officers of the Company, like all U.S. employees, are eligible to defer a portion of annual base salary and bonus (in certain cases), on a pre-tax basis, to the Company’s qualified 401(k) plan, up to the IRS contribution limits. Officers are also eligible to defer up to 18% of their base salary, less contributions to the 401(k) plan, to a non-qualified plan. Unlike other U.S. managers, officers are not eligible to elect to defer compensation into the Deferred Compensation and Restoration Plan. However, up to one hundred percent (100%) of annual incentive awards earned under the Company’s Performance Incentive Plan is eligible for deferral to a non-qualified plan. Officers may defer these amounts to unfunded book accounts or choose to have the amounts paid in cash on a current basis and deposited into individually established grantor trusts, net of tax withholdings. These amounts are credited annually with earnings. Officers do not receive tax gross ups on their grantor trusts. Officers elect the manner in which the assets held in their grantor trusts will be distributed to them upon retirement or other separation from the Company. |
| 50 | |
| BENEFITS AND PERQUISITES | DESCRIPTION | |
| Change in Control Arrangements | All named officers have change in control agreements, the purpose of which is to aid in retention and recruitment, encourage continued attention and dedication to assigned duties during periods involving a possible change in control of the Company, and protect the earned benefits of the officer against adverse changes resulting from a change in control. The level of payments provided under the agreements is established to be consistent with market practices as confirmed by data provided to the Committee by its independent compensation consultant. These arrangements are described in greater detail in the “Potential Payments Upon Termination or Change in Control” section of this proxy. | |
| Physical and Financial Wellness | To encourage the proactive management of executive health, named officers are eligible to participate in an executive health program that includes an annual physical exam and health consultation. Similarly, to promote financial wellness, named officers are eligible to receive up to $10,000 of fees annually associated with estate planning advice, tax preparation, and general financial planning. If an officer chooses to utilize these benefits, fees for services received are paid by the Company and are treated as imputed income to the officer, who then is responsible for payment of all taxes due on the fees paid by the Company. | |
| Company Automobile | Named officers are eligible for use of a Company-leased vehicle, with a lease term of 50 months. Seventy-five percent (75%) of the cost of the vehicle is imputed to the officer as income for federal income tax purposes. | |
| Company Aircraft | Non-business-related flights on corporate aircraft by Mr. Ford are covered by a time-sharing lease agreement, pursuant to which incremental costs associated with those flights are reimbursed by the executive to the Company in accordance with Federal Aviation Administration regulations. | |
| Disability Benefit | In addition to Abbott’s standard disability benefits, the U.S. named officers are eligible for a monthly long-term disability benefit, which is described in greater detail in the “Potential Payments Upon Termination or Change in Control” section of this proxy. |
SHARE OWNERSHIP AND RETENTION GUIDELINES
To further promote sustained shareholder returns and to ensure the Company’s executives remain focused on both short- and long-term objectives, the Company has established share ownership guidelines. Each officer has five years from the date appointed/elected to his/her position to achieve the ownership level associated with the position.
| ROLE | GUIDELINE |
| Chief Executive Officer | 6 times base salary |
| Executive Vice Presidents | 3 times base salary |
| Senior Vice Presidents | 3 times base salary |
| All other officers | 2 times base salary |
Any officer who has not achieved at least 50% of the share ownership guideline after three years in their current position will be required to hold 50% of future equity awards until they meet the ownership guideline. All named officers with 5 years tenure in their current position meet or exceed the guidelines.
|
51 |
HEDGING
Directors and officers are prohibited from entering into or engaging in any financial transaction that is designed to reduce the financial risk associated with owning Abbott shares. These financial transactions include, but are not limited to, engaging in short sales, derivative transactions (such as equity swaps, straddles, puts, or calls), and hedging or monetizing transactions (such as collars, exchange funds, or prepaid forward variable contracts) that are linked directly to Abbott stock.
PLEDGING
Directors and officers are prohibited from holding Abbott stock in a margin account, pledging Abbott stock, or otherwise securing any of their obligations by assigning Abbott stock as collateral.
RECOUPMENT POLICIES
In 2023, Abbott adopted a Dodd-Frank compliant clawback policy.
Additionally, our recoupment provisions go beyond the requirements of clawback rules under Dodd-Frank. The Compensation Committee maintains broad discretion to administer and implement the Company’s preexisting recoupment policy and seek recoupment of both performance-based and time-based equity, or cash incentive awards if it determines that a senior executive engaged in misconduct or failed in a supervisory capacity, resulting in a material violation of law or Abbott policy that causes significant financial harm to Abbott. The Compensation Committee may recover incentive compensation awarded to a senior executive in the prior three years or reduce future awards.
TIMING OF OPTION GRANTS
Abbott’s practice is for the Committee to approve annual option awards for officers at its regularly scheduled February meeting, with a grant date that is two business days later. This timing enables the Committee to grant option awards based on full year performance for each officer as well as Abbott’s performance relative to its peers. Abbott’s Board and Committee meetings are scheduled more than one year in advance and follow the same general cadence year-over-year. The Committee also may grant option awards to officers at other times for new hires, promotions, retention, or other purposes. The Committee does not take material nonpublic information into account when determining the timing or terms of any option award, and Abbott does not time the disclosure of material nonpublic information for the purpose of affecting the value of executive compensation.
COMPLIANCE
The Committee considers the deductibility of executive compensation in making its compensation decisions, but believes that shareholder interests are best served by not restricting the Committee’s discretion and flexibility in crafting compensation programs, even if such programs may result in certain non-deductible compensation expenses. Accordingly, Abbott may provide compensation that is not deductible.
| 52 | |
| COMPENSATION COMMITTEE REPORT |
The Compensation Committee of the Board is primarily responsible for reviewing, approving, and overseeing Abbott’s compensation plans and practices, and works with management and the Committee’s independent consultant to establish Abbott’s executive compensation philosophy and programs. The Committee has reviewed and discussed the Compensation Discussion and Analysis with management and has recommended to the Board that the Compensation Discussion and Analysis be included in this proxy statement.
Compensation Committee
D. J. Starks, Chair
M. A. Kumbier
N. McKinstry
M. G. O’Grady
M. F. Roman
| COMPENSATION RISK ASSESSMENT |
During 2024, Abbott conducted its annual risk assessment of its compensation policies and plan design practices for employees and executives. Abbott’s risk assessment is reinforced by Abbott’s adherence to a number of industry-leading best practices, including:
| ● | Compensation Committee chaired by independent, non-employee director |
| ● | Representation from the Audit Committee on the Compensation Committee |
| ● | Review of executive compensation programs by the Compensation Committee’s independent consultant |
| ● | Robust review of compensation program design elements, key performance drivers and pay for performance alignment |
| ● | Detailed measurement of short- and long-term compensation elements, and related performance metrics and requirements, to ensure balance |
| ● | Review of Abbott’s historical performance, peer performance and Board-approved strategic plan and related financial goals to determine appropriate incentive plan goals |
| ● | Incorporation of multiple program requirements that mitigate excessive risk-taking (e.g., updated Dodd Frank compliant recoupment policy, stock ownership and share retention guidelines, maximum payouts on short and long-term incentives) |
Based on this assessment, Abbott determined its compensation and benefit programs appropriately align employees’ compensation and performance without incentivizing risky behaviors. We concluded that risks arising from compensation policies and practices are not reasonably likely to have a material adverse effect on Abbott or its shareholders.
The following factors were among those considered:
| ● | Regular training on code of business conduct and policies and procedures is mandatory for all employees. |
| ● | Compensation structure encourages employees to regard Abbott as a career employer, to consider the long-term impact of their decisions, and to align their interests with those of Abbott’s shareholders (e.g., equity awards that vest over multi-year periods, ten-year term on stock options, and service-based retirement plans). |
|
53 |
| ● | Annual competitive benchmarking ensures performance achievement and incentive payout opportunities that are aligned with a peer group that reflects the size, investment profile, operating characteristics, and employment and business markets of Abbott. Appropriateness of this group is assessed annually by the Compensation Committee’s independent consultant and reviewed and approved by the Compensation Committee. Our selection criteria and peer companies are reported each year to our shareholders and have received favorable reviews. |
| ● | Abbott’s annual incentive plan places an appropriate weighting on earnings achievement by balancing it with other factors, including key operational and strategic measures, disclosed to shareholders. Since earnings are a key component of stock price performance, this aspect of Abbott’s compensation plan promotes alignment with shareholder interests without creating duplication across incentive plans. In 2023, we adopted a maximum payout of 200% of target. |
| ● | Abbott’s long-term incentive plan focuses on longer-term operating performance and shareholder returns and awards 50% stock options and 50% performance based restricted stock to senior executives. In 2024, approximately 70% of named executive officer total compensation was in the form of long-term equity incentives that can be earned or vest over multiple years. |
| ● | Equity awards are made, and grant values are determined, at the same time each year (i.e., at the Compensation Committee’s regularly scheduled meeting). In addition, Abbott does not reprice or backdate stock options, award discounted stock options, or immediately vest stock options or restricted stock. Equity awards are based on multiple performance factors and are set at competitive market levels, adjusted by Abbott’s long-term performance vs. our Committee-approved peer group. Both executive and Director share ownership guidelines and share retention requirements promote alignment with shareholders. |
| ● | Abbott’s compensation program does not include features that could encourage excessive risk taking (e.g., over-weighting toward annual incentives, highly leveraged payout curves, uncapped incentive award payments, unreasonable thresholds, or steep payout cliffs at certain levels that may encourage short-term business decisions to meet payout criteria). |
| ● | In 2023, Abbott adopted a Dodd-Frank compliant clawback policy. Additionally, the Compensation Committee maintains broad discretion to administer and implement the Company’s preexisting recoupment policy and seek recoupment of equity or cash incentive awards if it determines that a senior executive engaged in misconduct or failed in a supervisory capacity, resulting in a material violation of law or Abbott policy that causes significant financial harm to Abbott. The Compensation Committee may recover incentive compensation awarded to a senior executive in the prior three years or reduce future awards. |
| ● | Abbott’s hedging policy prohibits directors and officers from entering into financial transactions designed to reduce the financial risk associated with owning Abbott shares. |
| ● | Abbott’s pledging policy prohibits directors and officers from holding Abbott shares in a margin account, pledging Abbott shares, or securing obligations by assigning Abbott shares as collateral. |
This assessment was discussed with the Compensation Committee and its independent compensation consultant. The Committee and the consultant both agreed with the assessment.
| 54 | |
| SUMMARY COMPENSATION TABLE |
The following table summarizes compensation awarded to, earned by, or paid to the named officers. The section of the proxy statement captioned, “Compensation Discussion and Analysis—Basis for Compensation Decisions” describes in greater detail the information reported in this table.
| Name and Principal Position | Year | Salary | Stock Awards(2) | Option Awards(3) | Non-Equity Incentive Plan Compensation(4) | Change in Pension Value and Non-Qualified Deferred Compensation Earnings(5) | All Other Compensation(6) | SEC Total | Total Without Change in Pension Value(7) | ||||||||||||||||||
| Robert
B. Ford, Chairman of the Board and Chief Executive Officer | 2024 | $ | 1,500,000 | $ | 8,226,593 | $ | 8,227,441 | $ | 2,861,250 | $ | 1,342,793 | $ | 618,998 | $ | 22,777,075 | $ | 22,591,322 | ||||||||||
| 2023 | 1,500,000 | 7,436,600 | 7,437,649 | 2,945,250 | 3,665,280 | 283,392 | 23,268,171 | 20,373,964 | |||||||||||||||||||
| 2022 | 1,500,000 | 8,699,609 | 8,699,985 | 2,231,250 | 269,586 | 321,722 | 21,722,152 | 21,722,152 | |||||||||||||||||||
| Philip
P. Boudreau, Executive Vice President, Finance and Chief Financial Officer | 2024 | 884,039 | 2,693,071 | 2,693,336 | 1,224,700 | 655,852 | 74,748 | 8,225,746 | 7,597,619 | ||||||||||||||||||
| 2023 | 513,943 | 786,041 | 786,272 | 583,500 | 603,343 | 44,083 | 3,317,182 | 2,727,268 | |||||||||||||||||||
| Hubert L. Allen, Executive Vice President, General Counsel and Secretary | 2024 | 911,154 | 2,095,365 | 2,095,609 | 1,094,700 | 1,244,337 | 540,170 | 7,981,335 | 7,527,867 | ||||||||||||||||||
| 2023 | 830,000 | 1,959,639 | 1,959,993 | 941,700 | 1,500,412 | 228,916 | 7,420,660 | 6,491,684 | |||||||||||||||||||
| 2022 | 817,615 | 2,396,766 | 2,396,850 | 871,500 | 214,873 | 322,031 | 7,019,635 | 7,019,635 | |||||||||||||||||||
| Lisa D. Earnhardt, Executive Vice President and Group President, Medical Devices | 2024 | 879,269 | 2,016,528 | 2,016,819 | 1,249,200 | 266,598 | 130,047 | 6,558,461 | 6,444,774 | ||||||||||||||||||
| 2023 | 737,654 | 1,684,197 | 1,684,477 | 904,900 | 401,828 | 85,380 | 5,498,436 | 5,196,818 | |||||||||||||||||||
| Daniel G. Salvadori, Executive Vice President and Group President, Established Pharmaceuticals and Nutritional Products | 2024 | 879,269 | 1,833,239 | 1,833,495 | 855,400 | 231,344 | 157,015 | 5,789,762 | 5,789,762 | ||||||||||||||||||
| 2023 | 790,000 | 1,880,183 | 1,880,493 | 880,300 | 411,877 | 91,977 | 5,934,830 | 5,662,042 | |||||||||||||||||||
| 2022 | 790,000 | 2,812,276 | 2,812,489 | 600,500 | 45,607 | 96,812 | 7,157,684 | 7,157,684 | |||||||||||||||||||
| Robert
E. Funck, Jr.(1) Former Executive Vice President, Finance | 2024 | 535,096 | 2,867,938 | 2,868,225 | 564,000 | 869,612 | 553,057 | 8,257,928 | 8,257,928 | ||||||||||||||||||
| 2023 | 875,000 | 2,593,908 | 2,594,349 | 1,062,100 | 1,628,061 | 238,790 | 8,992,208 | 7,992,913 | |||||||||||||||||||
| 2022 | 866,154 | 3,372,286 | 3,372,494 | 956,000 | 236,568 | 341,718 | 9,145,220 | 9,145,220 | |||||||||||||||||||
| (1) | Mr. Funck retired from Abbott effective July 1, 2024. |
| (2) | In accordance with the Securities and Exchange Commission (SEC) rules, the amounts in this column represent the aggregate grant date fair value of the awards in accordance with Financial Accounting Standards Board ASC Topic 718. Abbott determines grant date fair value by multiplying the number of shares granted by the average of the high and low market prices of an Abbott common share on the award’s date of grant. |
| (3) | In accordance with SEC rules, the amounts in this column represent the aggregate grant date fair value of the awards in accordance with Financial Accounting Standards Board ASC Topic 718. These amounts were determined as of the option’s grant date using a Black-Scholes stock option valuation model. These amounts are being reported solely for the purpose of comparative disclosure in accordance with SEC rules. There is no certainty that the amount determined using a Black-Scholes stock option valuation model would be the value at which employee stock options would be traded for cash. The assumptions are the same as those described in Note 9, entitled “Incentive Stock Program” of Abbott’s Notes to Consolidated Financial Statements included under Item 8, “Financial Statements and Supplementary Data” in Abbott’s 2024 Annual Report on SEC Form 10-K. |
| (4) | This compensation is earned as a performance-based incentive bonus, pursuant to the 1998 Abbott Laboratories Performance Incentive Plan. Additional information regarding the Performance Incentive Plan can be found in the section of this proxy statement captioned, “Compensation Discussion and Analysis—Basis for Compensation Decisions.” |
|
55 |
| (5) | The plan amounts shown below are reported in this column. |
| For Messrs. Ford, Allen, Salvadori, and Funck, Jr., the amounts shown alongside the officer’s name are for 2024, 2023, and 2022, respectively. For Mr. Boudreau and Ms. Earnhardt, the amounts shown are for 2024 and 2023. | |
| Abbott Laboratories Annuity Retirement Plan | |
| R. B. Ford: ($4,208) / $116,664 / ($220,128); P. P. Boudreau: ($33) / $109,932; H. L. Allen: $71,983 / $95,131 / ($88,718); L. D. Earnhardt: $9,991 / $35,501; D. G. Salvadori: $7,308 / $30,508 / ($53,150); and R. E. Funck, Jr.: ($137,550) / $111,386 / ($185,077). | |
| Abbott Laboratories Supplemental Pension Plan | |
| R. B. Ford: $189,961 / $2,777,543 / ($2,544,153); P. P. Boudreau: $628,160 / $479,982; H. L. Allen: $381,485 / $833,845 / ($770,934); L. D. Earnhardt: $103,696 / $266,117; D. G. Salvadori: ($19,417) / $242,280 / ($442,633); and R. E. Funck, Jr.: ($485,777) / $887,909 / ($962,130). | |
| Non-Qualified Defined Contribution Plan Earnings | |
| The totals in this column include reportable interest credited under the 1998 Abbott Laboratories Performance Incentive Plan, the Abbott Laboratories 401(k) Supplemental Plan, and the 1986 Abbott Laboratories Management Incentive Plan (although none of the named officers currently receives awards under this plan). | |
| R. B. Ford: $1,157,040 / $771,073 / $269,586; P. P. Boudreau: $27,725 / $13,429; H. L. Allen: $790,869 / $571,436 / $214,873; L. D. Earnhardt: $152,911 / $100,210; D. G. Salvadori: $231,344 / $139,089 / $45,607; and R. E. Funck, Jr.: $869,612 / $628,766 / $236,568. | |
| (6) | The amounts shown below are reported in this column. |
| For Messrs. Ford, Allen, Salvadori, and Funck, Jr., the amounts shown alongside the officer’s name are for 2024, 2023, and 2022, respectively. For Mr. Boudreau and Ms. Earnhardt, the amounts shown are for 2024 and 2023. | |
| Earnings on Non-Qualified Defined Contribution Plans (net of the reportable interest included in footnote 5) | |
| R. B. Ford: $536,731 / $153,521 / $240,102; P. P. Boudreau: $627 / $216; H. L. Allen: $460,106 / $149,665 / $246,845; L. D. Earnhardt: $70,652 / $18,159; D. G. Salvadori: $67,546 / $17,270 / $24,607; and R. E. Funck, Jr.: $500,593 / $164,510 / $268,399. | |
| Each of the named officers’ awards under the 1998 Abbott Laboratories Performance Incentive Plan is paid in cash to the officer on a current basis. Each of the named officers has a grantor trust into which the awards may be deposited, net of maximum tax withholdings. The named officers also have grantor trusts in connection with the Abbott Laboratories 401(k) Supplemental Plan and the 1986 Abbott Laboratories Management Incentive Plan (although none of the named officers currently receives awards under the Management Incentive Plan). These amounts include the trusts’ earnings (net of the reportable interest included in footnote 5). | |
| Employer Contributions to Defined Contribution Plans | |
| R. B. Ford: $75,000 / $75,000 / $75,000; P. P. Boudreau: $44,202 / $25,697; H. L. Allen: $45,558 / $41,500 / $40,881; L. D. Earnhardt: $43,964 / $36,883; D. G. Salvadori: $43,964 / $39,500 / $39,501; and R. E. Funck, Jr.: $22,716 / $43,750 / $43,308. | |
| These amounts include employer contributions to both Abbott’s tax-qualified defined contribution plan and the Abbott Laboratories 401(k) Supplemental Plan. The Abbott Laboratories 401(k) Supplemental Plan permits eligible Abbott officers to contribute amounts in excess of the limit set by the Internal Revenue Code for employee contributions to 401(k) plans up to the excess of (i) 18% of their base salary over (ii) the amount contributed to Abbott’s tax-qualified 401(k) plan. Abbott matches participant contributions at the rate of 250% of the first 2% of compensation contributed to the plan. The named officers have these amounts paid to them in cash on a current basis and deposited into a grantor trust established by the officer, net of maximum tax withholdings. |
| 56 | |
| Other Compensation | |
| Mr. Ford’s non-business-related flights on corporate aircraft are covered by time-sharing lease agreements, pursuant to which he reimburses Abbott for certain costs associated with those flights in accordance with Federal Aviation Administration regulations. The following amounts are included in the totals in this column, which reflect Abbott’s incremental cost less reimbursements for non-business-related flights: $7,267 / $54,871 / $6,620. | |
| Abbott determines the incremental cost for flights based on the direct cost to Abbott, including fuel costs, parking, handling and landing fees, catering, travel fees, and other miscellaneous direct costs. | |
| Also included in the totals shown in the table is the cost of providing a corporate automobile less the amount reimbursed by the officer: P. P. Boudreau: $23,359 / $17,620; H. L. Allen: $24,506 / $27,751 / $24,305; L. D. Earnhardt: $5,234 / $20,338; D. G. Salvadori: $29,895 / $25,207 / $22,704; and R. E. Funck, Jr.: $14,078 / $21,513 / $22,480. | |
| The following costs associated with financial planning are included: P. P. Boudreau: $950 / $550; H. L. Allen: $10,000 / $10,000 / $10,000; L. D. Earnhardt: $10,000 / $10,000; D. G. Salvadori: $10,000 / $10,000 / $10,000; and R. E. Funck, Jr.: $10,000 / $8,990 / $6,895. | |
| The following costs associated with health program benefits in 2024 are included: P. P. Boudreau: $5,610; D. G. Salvadori: $5,610; and R. E. Funck, Jr.: $5,610. | |
| The named officers are also eligible to participate in an executive disability benefit described on page 66. | |
| (7) | To demonstrate how year over year changes in pension value impact total compensation, as determined under SEC rules, we have included this column to show total compensation without pension value changes. The amounts reported in this column are calculated by subtracting the change in pension value reported in the Change in Pension Value and Non-Qualified Deferred Compensation Earnings column, as described in footnote 5 to this table, from the amounts reported in the SEC Total column. The amounts reported in this column differ from, and are not a substitute for, the amounts reported in the SEC Total column. |
|
57 |
| 2024 GRANTS OF PLAN BASED AWARDS |
| Name | Grant Date |
Approval Date |
Estimated Future Payouts Under Non-Equity Incentive Plan Awards(1) |
Estimated
Future Payouts Under Equity Incentive Plan Awards Target (#)(2)(3) |
All
Other Option Awards: Numbers of Securities Underlying Options (#)(4) |
Exercise
or Base Price of Options Awards ($/Sh.) |
Closing
Market Price on Grant Date |
Grant Date Fair Value of Stock and Option Awards | ||||||||||
| Target ($) |
Maximum ($) |
|||||||||||||||||
| R. B. Ford | 2/21/2024 | 2/16/2024 | 70,332 | $8,226,593(5) | ||||||||||||||
| 2/21/2024 | 2/16/2024 | 264,293 | $116.98 | $117.87 | 8,227,441(6) | |||||||||||||
| P. P. Boudreau | 2/21/2024 | 2/16/2024 | 23,024 | 2,693,071(5) | ||||||||||||||
| 2/21/2024 | 2/16/2024 | 86,519 | 116.98 | 117.87 | 2,693,336(6) | |||||||||||||
| H. L. Allen | 2/21/2024 | 2/16/2024 | 17,914 | 2,095,365(5) | ||||||||||||||
| 2/21/2024 | 2/16/2024 | 67,318 | 116.98 | 117.87 | 2,095,609(6) | |||||||||||||
| L. D. Earnhardt | 2/21/2024 | 2/16/2024 | 17,240 | 2,016,528(5) | ||||||||||||||
| 2/21/2024 | 2/16/2024 | 64,787 | 116.98 | 117.87 | 2,016,819(6) | |||||||||||||
| D. G. Salvadori | 2/21/2024 | 2/16/2024 | 15,673 | 1,833,239(5) | ||||||||||||||
| 2/21/2024 | 2/16/2024 | 58,898 | 116.98 | 117.87 | 1,833,495(6) | |||||||||||||
| R. E. Funck, Jr. | 2/21/2024 | 2/16/2024 | 24,519 | 2,867,938(5) | ||||||||||||||
| 2/21/2024 | 2/16/2024 | 92,137 | 116.98 | 117.87 | 2,868,225(6) | |||||||||||||
| (1) | During 2024, each of the named officers participated in the 1998 Abbott Laboratories Performance Incentive Plan, an annual, non-equity incentive plan. The annual cash incentive award earned by the named officer in 2024 under the plan is shown in the Summary Compensation Table under the column captioned, “Non-Equity Incentive Plan Compensation.” No future payouts will be made under the plan’s 2024 annual cash incentive award. |
| The Performance Incentive Plan is described in greater detail in the section of the proxy statement captioned, “Compensation Discussion and Analysis—Basis for Compensation Decisions.” | |
| (2) | These are performance-based restricted stock awards that have a 3-year term and vest upon Abbott reaching a minimum return on equity target, with no more than one-third of the award vesting in any one year. In 2024, Abbott reached its minimum return on equity target and one-third of each of the awards granted on February 21, 2024 vested on February 28, 2025. The equity targets are described in the section of the proxy statement captioned, “Compensation Discussion and Analysis—Basis for Compensation Decisions.” |
| (3) | In the event of a grantee’s death or disability, these awards are deemed fully earned. The treatment of these awards upon a change in control is described in the section of the proxy statement captioned, “Potential Payments Upon Termination or Change in Control—Equity Awards.” Outstanding restricted shares and restricted stock units receive dividend payments at the same rate as all other shareholders. |
| (4) | Options with respect to one-third of the shares covered by these awards are exercisable after one year; two-thirds after two years; and all after three years. The options vest in the event of the grantee’s death or disability. The treatment of these awards upon a change in control is described in the section of the proxy statement captioned, “Potential Payments Upon Termination or Change in Control—Equity Awards.” Under the Abbott Laboratories 2017 Incentive Stock Program, these options have an exercise price equal to the average of the high and low market prices (rounded-up to the next even penny) of an Abbott common share on the date of grant. |
| (5) | Abbott determines the grant date fair value of stock and stock unit awards by multiplying the number of restricted shares or restricted stock units granted by the average of the high and low market prices of a common share on the grant date. |
| (6) | These values were determined as of the option’s grant date using a Black-Scholes stock option valuation model. The model uses the assumptions described in Note 9, entitled “Incentive Stock Program” of Abbott’s Notes to Consolidated Financial Statements included under Item 8, “Financial Statements and Supplemental Data” in Abbott’s 2024 Annual Report on SEC Form 10-K. |
| 58 | |
| 2024 OUTSTANDING EQUITY AWARDS AT FISCAL YEAR END |
The following table summarizes the outstanding equity awards held by the named officers at year end.
| Option Awards(1)(2) | Stock Awards(2) | |||||||||||||||||||||||||||||||||||
| Name | Number
of Securities Underlying Unexercised Options (#) Exercisable | Number
of Securities Underlying Unexercised Options (#) Unexercisable | Equity Incentive Plan Awards: Number of Securities Underlying Unexercised Unearned Options (#) | Option Exercise Price ($) | Option Expiration Date | Number of Shares or Units of Stock That Have Not Vested (#) | Market Value of Shares or Units of Stock That Have Not Vested ($) | Equity Incentive Plan Awards: Number of Unearned Shares, Units or Other Rights That Have Not Vested (#) | Equity Incentive Plan Awards: Market or Payout Value of Unearned Shares, Units or Other Rights That Have Not Vested ($) | |||||||||||||||||||||||||||
| R. B. Ford | 24,664 | $ | 2,789,745 | |||||||||||||||||||||||||||||||||
| 46,672 | 5,279,070 | |||||||||||||||||||||||||||||||||||
| 70,332 | 7,955,252 | |||||||||||||||||||||||||||||||||||
| 285,388 | $ | 38.40 | 2/18/2026 | |||||||||||||||||||||||||||||||||
| 151,869 | 44.40 | 2/16/2027 | ||||||||||||||||||||||||||||||||||
| 246,963 | 59.94 | 2/15/2028 | ||||||||||||||||||||||||||||||||||
| 240,059 | 75.90 | 2/21/2029 | ||||||||||||||||||||||||||||||||||
| 390,896 | 87.72 | 2/20/2030 | ||||||||||||||||||||||||||||||||||
| 359,090 | 124.04 | 2/18/2031 | ||||||||||||||||||||||||||||||||||
| 229,884 | 114,943 | 117.58 | 2/17/2032 | |||||||||||||||||||||||||||||||||
| 92,027 | 184,055 | 106.24 | 2/16/2033 | |||||||||||||||||||||||||||||||||
| 264,293 | 116.98 | 2/20/2034 | ||||||||||||||||||||||||||||||||||
| P. P. Boudreau | 1,783 | $ | 201,675 | |||||||||||||||||||||||||||||||||
| 3,236 | 366,024 | |||||||||||||||||||||||||||||||||||
| 1,747 | 197,603 | |||||||||||||||||||||||||||||||||||
| 23,024 | 2,604,245 | |||||||||||||||||||||||||||||||||||
| 29,020 | $ | 87.72 | 2/20/2030 | |||||||||||||||||||||||||||||||||
| 25,613 | 124.04 | 2/18/2031 | ||||||||||||||||||||||||||||||||||
| 16,625 | 8,313 | 117.58 | 2/17/2032 | |||||||||||||||||||||||||||||||||
| 6,383 | 12,766 | 106.24 | 2/16/2033 | |||||||||||||||||||||||||||||||||
| 3,407 | 6,816 | 103.18 | 8/31/2033 | |||||||||||||||||||||||||||||||||
| 86,519 | 116.98 | 2/20/2034 | ||||||||||||||||||||||||||||||||||
| H. L. Allen | 6,795 | $ | 768,582 | |||||||||||||||||||||||||||||||||
| 12,298 | 1,391,027 | |||||||||||||||||||||||||||||||||||
| 17,914 | 2,026,253 | |||||||||||||||||||||||||||||||||||
| 189,788 | $ | 38.40 | 2/18/2026 | |||||||||||||||||||||||||||||||||
| 167,056 | 44.40 | 2/16/2027 | ||||||||||||||||||||||||||||||||||
| 246,963 | 59.94 | 2/15/2028 | ||||||||||||||||||||||||||||||||||
| 151,933 | 75.90 | 2/21/2029 | ||||||||||||||||||||||||||||||||||
| 130,298 | 87.72 | 2/20/2030 | ||||||||||||||||||||||||||||||||||
| 87,422 | 124.04 | 2/18/2031 | ||||||||||||||||||||||||||||||||||
| 63,333 | 31,667 | 117.58 | 2/17/2032 | |||||||||||||||||||||||||||||||||
| 24,251 | 48,503 | 106.24 | 2/16/2033 | |||||||||||||||||||||||||||||||||
| 67,318 | 116.98 | 2/20/2034 | ||||||||||||||||||||||||||||||||||
|
59 |
| Option Awards(1)(2) | Stock Awards(2) | |||||||||||||||||||||||||||||||||||
| Name | Number
of Securities Underlying Unexercised Options (#) Exercisable | Number
of Securities Underlying Unexercised Options (#) Unexercisable | Equity Incentive Plan Awards: Number of Securities Underlying Unexercised Unearned Options (#) | Option Exercise Price ($) | Option Expiration Date | Number of Shares or Units of Stock That Have Not Vested (#) | Market Value of Shares or Units of Stock That Have Not Vested ($) | Equity Incentive Plan Awards: Number of Unearned Shares, Units or Other Rights That Have Not Vested (#) | Equity Incentive Plan Awards: Market or Payout Value of Unearned Shares, Units or Other Rights That Have Not Vested ($) | |||||||||||||||||||||||||||
| L. D. Earnhardt | 5,749 | $ | 650,269 | |||||||||||||||||||||||||||||||||
| 10,570 | 1,195,573 | |||||||||||||||||||||||||||||||||||
| 17,240 | 1,950,016 | |||||||||||||||||||||||||||||||||||
| 91,367 | $ | 80.98 | 6/9/2029 | |||||||||||||||||||||||||||||||||
| 114,940 | 87.72 | 2/20/2030 | ||||||||||||||||||||||||||||||||||
| 71,070 | 124.04 | 2/18/2031 | ||||||||||||||||||||||||||||||||||
| 53,586 | 26,794 | 117.58 | 2/17/2032 | |||||||||||||||||||||||||||||||||
| 20,842 | 41,685 | 106.24 | 2/16/2033 | |||||||||||||||||||||||||||||||||
| 64,787 | 116.98 | 2/20/2034 | ||||||||||||||||||||||||||||||||||
| D. G. Salvadori | 7,973 | $ | 901,826 | |||||||||||||||||||||||||||||||||
| 11,800 | 1,334,698 | |||||||||||||||||||||||||||||||||||
| 15,673 | 1,772,773 | |||||||||||||||||||||||||||||||||||
| 23,771 | $ | 38.40 | 2/18/2026 | |||||||||||||||||||||||||||||||||
| 75,591 | 44.40 | 2/16/2027 | ||||||||||||||||||||||||||||||||||
| 49,611 | 50.72 | 7/20/2027 | ||||||||||||||||||||||||||||||||||
| 182,935 | 59.94 | 2/15/2028 | ||||||||||||||||||||||||||||||||||
| 162,430 | 75.90 | 2/21/2029 | ||||||||||||||||||||||||||||||||||
| 132,182 | 87.72 | 2/20/2030 | ||||||||||||||||||||||||||||||||||
| 98,708 | 124.04 | 2/18/2031 | ||||||||||||||||||||||||||||||||||
| 74,316 | 37,158 | 117.58 | 2/17/2032 | |||||||||||||||||||||||||||||||||
| 23,267 | 46,536 | 106.24 | 2/16/2033 | |||||||||||||||||||||||||||||||||
| 58,898 | 116.98 | 2/20/2034 | ||||||||||||||||||||||||||||||||||
| R. E. Funck, Jr. | 9,560 | $ | 1,081,332 | |||||||||||||||||||||||||||||||||
| 16,279 | 1,841,318 | |||||||||||||||||||||||||||||||||||
| 24,519 | 2,773,344 | |||||||||||||||||||||||||||||||||||
| 48,831 | $ | 44.40 | 2/16/2027 | |||||||||||||||||||||||||||||||||
| 110,146 | 59.94 | 2/15/2028 | ||||||||||||||||||||||||||||||||||
| 122,367 | 75.90 | 2/21/2029 | ||||||||||||||||||||||||||||||||||
| 154,013 | 87.72 | 2/20/2030 | ||||||||||||||||||||||||||||||||||
| 123,966 | 124.04 | 2/18/2031 | ||||||||||||||||||||||||||||||||||
| 89,113 | 44,557 | 117.58 | 2/17/2032 | |||||||||||||||||||||||||||||||||
| 32,100 | 64,201 | 106.24 | 2/16/2033 | |||||||||||||||||||||||||||||||||
| 92,137 | 116.98 | 2/20/2034 | ||||||||||||||||||||||||||||||||||
| (1) | Except as noted, these options are fully vested. |
| 60 | |
| (2) | The vesting dates of outstanding unexercisable stock options and unvested restricted stock awards at December 31, 2024 are as follows. |
| Option Awards | Stock Awards(a) | |||||||||||
| Name | Number
of Unexercised Shares Remaining from Original Grant | Number
of Option Shares Vesting—Date Vested 2025 | Number
of Option Shares Vesting—Date Vesting 2026 | Number
of Option Shares Vesting—Date Vesting 2027 | Number
of Restricted Shares or Units | Number
of Restricted Shares or Units Vesting— Date Vested 2025 | ||||||
| R. B. Ford | 114,943 | 114,943 – 2/18 | 24,664 | (b) | ||||||||
| 184,055 | 92,027 – 2/17 | 92,028 – 2/17 | 46,672 | (c) | ||||||||
| 264,293 | 88,097 – 2/21 | 88,098 – 2/21 | 88,098 – 2/21 | 70,332 | (d) | |||||||
| P. P. Boudreau | 8,313 | 8,313 – 2/18 | 1,783 | (b) | ||||||||
| 12,766 | 6,383 – 2/17 | 6,383 – 2/17 | 3,236 | (c) | ||||||||
| 6,816 | 3,408 – 9/1 | 3,408 – 9/1 | 1,747 | (e) | ||||||||
| 86,519 | 28,839 – 2/21 | 28,840 – 2/21 | 28,840 – 2/21 | 23,024 | (d) | |||||||
| H. L. Allen | 31,667 | 31,667 – 2/18 | 6,795 | (b) | ||||||||
| 48,503 | 24,251 – 2/17 | 24,252 – 2/17 | 12,298 | (c) | ||||||||
| 67,318 | 22,439 – 2/21 | 22,439 – 2/21 | 22,440 – 2/21 | 17,914 | (d) | |||||||
| L. D. Earnhardt | 26,794 | 26,794 – 2/18 | 5,749 | (b) | ||||||||
| 41,685 | 20,842 – 2/17 | 20,843 – 2/17 | 10,570 | (c) | ||||||||
| 64,787 | 21,595 – 2/21 | 21,596 – 2/21 | 21,596 – 2/21 | 17,240 | (d) | |||||||
| D. G. Salvadori | 37,158 | 37,158 – 2/18 | 7,973 | (b) | ||||||||
| 46,536 | 23,268 – 2/17 | 23,268 – 2/17 | 11,800 | (c) | ||||||||
| 58,898 | 19,632 – 2/21 | 19,633 – 2/21 | 19,633 – 2/21 | 15,673 | (d) | |||||||
| R. E. Funck, Jr. | 44,557 | 44,557 – 2/18 | 9,560 | (b) | ||||||||
| 64,201 | 32,100 – 2/17 | 32,101 – 2/17 | 16,279 | (c) | ||||||||
| 92,137 | 30,712 – 2/21 | 30,712 – 2/21 | 30,713 – 2/21 | 24,519 | (d) | |||||||
| (a) | The equity targets are described in the section of the proxy statement captioned, “Compensation Discussion and Analysis—Basis for Compensation Decisions.” |
| (b) | These are the restricted shares that remained outstanding and unvested on December 31, 2024, from an award made on February 18, 2022. The award has a 3-year term with no more than one-third of the original award vesting in any one year upon Abbott reaching a minimum return on equity target, measured at the end of the relevant year. In 2024, Abbott reached its minimum return on equity target and these shares vested on February 28, 2025. |
| (c) | These are the restricted shares that remained outstanding and unvested on December 31, 2024, from an award made on February 17, 2023. The award has a 3-year term with no more than one-third of the original award vesting in any one year upon Abbott reaching a minimum return on equity target, measured at the end of the relevant year. In 2024, Abbott reached its minimum return on equity target and half of these shares vested on February 28, 2025. |
| (d) | These are the restricted shares that remained outstanding and unvested on December 31, 2024, from an award made on February 21, 2024. The award has a 3-year term with no more than one-third of the original award vesting in any one year upon Abbott reaching a minimum return on equity target, measured at the end of the relevant year. In 2024, Abbott reached its minimum return on equity target and one-third of these shares vested on February 28, 2025. |
| (e) | These are the restricted shares that remained outstanding and unvested on December 31, 2024, from an award made on September 1, 2023. The award has a 3-year term, with no more than one-third of the original award vesting in any one year upon Abbott reaching a minimum return on equity target, measured at the end of the relevant year. In 2024, Abbott reached its minimum return on equity target and half of these shares will vest on September 1, 2025. |
|
61 |
| 2024 OPTION EXERCISES AND STOCK VESTED |
The following table summarizes for each named officer the number of shares the officer acquired on the exercise of stock options and the number of shares the officer acquired on the vesting of stock awards in 2024:
| Option Awards | Stock Awards | |||||||||||
| Name | Number of Shares Acquired on Exercise (#) | Value Realized on Exercise ($) | Number of Shares Acquired on Vesting (#) | Value Realized on Vesting ($) | ||||||||
| R. B. Ford | 141,679 | $ | 9,807,163 | 71,352 | $ | 8,565,808 | ||||||
| P. P. Boudreau | 0 | 0 | 5,941 | 707,298 | ||||||||
| H. L. Allen | 157,421 | 11,026,223 | 18,630 | 2,236,532 | ||||||||
| L. D. Earnhardt | 0 | 0 | 15,655 | 1,879,383 | ||||||||
| D. G. Salvadori | 0 | 0 | 20,292 | 2,436,055 | ||||||||
| R. E. Funck, Jr. | 55,097 | 3,716,265 | 25,762 | 3,092,728 | ||||||||
| PENSION BENEFITS |
During 2024, the named officers participated in two Abbott sponsored defined benefit pension plans: the Abbott Laboratories Annuity Retirement Plan, a tax qualified pension plan; and the Abbott Laboratories Supplemental Pension Plan, a non-qualified supplemental pension plan. The Supplemental Pension Plan also includes a benefit feature Abbott uses to attract officers who are at the mid-point of their careers. This feature provides an additional benefit to officers who are mid-career hires that is less valuable to officers who have spent most of their careers at Abbott. Except as provided in Abbott’s change in control agreements, Abbott does not have a policy granting extra years of credited service under the plans. These change in control agreements are described on pages 67 and 68.
The compensation considered in determining the pension payable to the named officers is the compensation shown in the “Salary” and “Non-Equity Incentive Plan Compensation” columns of the Summary Compensation Table on page 55.
ANNUITY RETIREMENT PLAN
The Annuity Retirement Plan covers eligible employees in the United States who are age 21 or older, and provides participants with a life annuity benefit at normal retirement equal to A plus the greater of B or C below.
| A. | 1.10% of 5-year final average earnings multiplied by years of benefit service after 2003. |
| B. | 1.65% of 5-year final average earnings multiplied by years of benefit service prior to 2004 (up to 20); plus 1.50% of 5-year final average earnings multiplied by years of benefit service prior to 2004 in excess of 20 (but no more than 15 additional years); less 0.50% of the lesser of 3-year final average earnings (but not more than the social security wage base in any year) or the social security covered compensation level multiplied by years of benefit service. |
| C. | 1.10% of 5-year final average earnings multiplied by years of benefit service prior to 2004. |
The benefit for service prior to 2004 (B or C above) is reduced for the cost of preretirement surviving spouse benefit protection. The reduction is calculated using formulas based on age and employment status during the period in which coverage was in effect.
| 62 | |
Final average earnings are the average of the employee’s 60 highest paid consecutive calendar months of compensation (salary and non-equity incentive plan compensation). The Annuity Retirement Plan covers earnings up to the limit imposed by Internal Revenue Code Section 401(a)(17) and provides for a maximum of 35 years of benefit service.
Participants become fully vested in their pension benefit upon the completion of five years of service. The benefit is payable on an unreduced basis at age 65. Participants hired after 2003 who terminate prior to age 55 with at least 10 years of service may choose to commence their benefits on an actuarially reduced basis as early as age 55. Participants hired prior to 2004 who terminate prior to age 50 with at least 10 years of service may choose to commence their benefits on an actuarially reduced basis as early as age 50. Participants hired prior to 2004 who terminate prior to age 50 with less than 10 years of service may choose to commence their benefits on an actuarially reduced basis as early as age 55.
The Annuity Retirement Plan offers several optional forms of payment, including certain and life annuities, joint and survivor annuities, and level income annuities. The benefit paid under any of these options is actuarially equivalent to the life annuity benefit produced by the formula described above.
Participants who retire from Abbott prior to their normal retirement age may receive subsidized early retirement benefits. Participants hired after 2003 are eligible for early retirement at age 55 with 10 years of service. Participants hired prior to 2004 are eligible for early retirement at age 50 with 10 years of service or age 55 if the employee’s age plus years of benefit service total 70 or more. As of December 31, 2024, Messrs. Ford, Boudreau, and Allen were eligible for early retirement benefits under the plan.
The subsidized early retirement reductions applied to the benefit payable for service after 2003 (A above) depend upon the participant’s age at retirement. If the participant retires after reaching age 55, the benefit is reduced 5 percent per year for each year that payments are made before age 62. If the participant retires after reaching age 50 but prior to reaching age 55, the benefit is actuarially reduced from age 65.
The early retirement reductions applied to the benefit payable for service prior to 2004 (B and C above) depend upon age and service at retirement:
| ● | In general, the 5-year final average earnings portions of the benefit are reduced 3 percent per year for each year that payments are made before age 62 and the 3-year final average earnings portion of the benefit is reduced 5 percent per year for each year that payments are made before age 62. |
| ● | Employees who participated in the plan before age 36 may elect “Special Retirement” on the last day of any month after reaching age 55 with age plus Seniority Service points of at least 94 or “Early Special Retirement” on the last day of any month after reaching age 55, provided their age plus Seniority Service points would reach at least 94 before age 65. Seniority Service includes periods of employment prior to attaining the minimum age required to participate in the plan. If Special Retirement or Early Special Retirement applies, Seniority Service is used in place of benefit service in the formulas. The 5-year final average earnings portions of the benefit in B above are reduced 1⅔ percent for each year between ages 59 and 62 plus 2½ percent for each year between ages 55 and 59. The 3-year final average earnings portion of the benefit is reduced 5 percent per year for each year that payments are made before age 62. Benefit C is payable on an unreduced basis at Special Retirement and is reduced 3 percent per year for each year that payments are made before age 62, if Early Special Retirement applies. |
|
63 |
SUPPLEMENTAL PENSION PLAN
With the following exceptions, the provisions of the Supplemental Pension Plan are substantially the same as those of the Annuity Retirement Plan:
| ● | Officers’ 5-year final average earnings are calculated using the average of the 5 highest years of base earnings and the 5 highest years of payments under Abbott’s non equity incentive plans. |
| ● | The Annuity Retirement Plan does not include amounts deferred or payments received under the Abbott Laboratories Deferred Compensation and Restoration Plan in its calculation of a participant’s final average earnings. To preserve the pension benefits of Deferred Compensation and Restoration Plan participants, the Supplemental Pension Plan includes amounts deferred by a participant under the Deferred Compensation and Restoration Plan in its calculation of final average earnings. Beginning in the year following their election as an officer, Abbott officers are no longer eligible to defer compensation under the Deferred Compensation and Restoration Plan. |
| ● | In addition to the benefits outlined above for the Annuity Retirement Plan, participating officers are eligible for a benefit equal to 0.6% of 5-year final average earnings for each year of service for each of the first 20 years of service occurring after the participant attains age 35. The benefit is further limited by the maximum percentage allowed under the Annuity Retirement Plan under that plan’s benefit formulas (A, B, and C above). The portion of this additional officer benefit attributable to service prior to 2004 is reduced 3 percent per year for each year that payments are made before the plan’s unreduced retirement age. The portion attributable to service after 2003 is reduced 5 percent per year for each year that payments are made before the plan’s unreduced retirement age if the participant is at least age 55 at early retirement. If the participant is under age 55 at retirement, the portion attributable to service after 2003 is actuarially reduced from age 65. |
| ● | The Supplemental Pension Plan provides early retirement benefits similar to those provided under the Annuity Retirement Plan. The benefits provided to Abbott’s officers under the Supplemental Pension Plan are reduced from the plan’s unreduced retirement age, unless the benefit is being actuarially reduced from age 65. As of December 31, 2024, Messrs. Ford, Boudreau, and Allen were eligible for early retirement benefits under the plan. |
| ● | Vested plan benefits accrued under the Supplemental Pension Plan may be funded through a grantor trust established by the officer. Consistent with the distribution requirements of Internal Revenue Code Section 409A and its regulations, those officers who were elected prior to 2009 may have the entire amount of their vested plan benefits funded through a grantor trust. Officers elected after 2008 may only have the vested plan benefits that accrue following the calendar year in which the officer is first elected funded through a grantor trust. Vested plan benefits accrued through December 31, 2008, to the extent not previously funded, were distributed to the participants’ individual trusts and included in the participants’ income. |
Benefits payable under the Supplemental Pension Plan are offset by the benefits payable from the Annuity Retirement Plan, calculated as if benefits under the plans commenced at the same time. The amounts paid to an officer’s Supplemental Pension Plan grantor trust to fund plan benefits are actuarially determined. The plan is designed to result in Abbott paying the officer’s Supplemental Pension Plan benefits to the extent assets held in the officer’s trust are insufficient.
| 64 | |
2024 PENSION BENEFITS
| Name | Plan Name | Number of Years Credited Service (#) | Present Value of Accumulated Benefit ($)(1) | Payments During Last Fiscal Year ($) | |||||||
| R. B. Ford | Abbott Laboratories Annuity Retirement Plan | 28 | $ | 596,899 | $ | 0 | |||||
| Abbott Laboratories Supplemental Pension Plan | 28 | 10,714,467 | 3,630,398 | (2) | |||||||
| P. P. Boudreau | Abbott Laboratories Annuity Retirement Plan | 28 | 584,978 | 0 | |||||||
| Abbott Laboratories Supplemental Pension Plan | 28 | 2,323,590 | 596,622 | (2) | |||||||
| H. L. Allen | Abbott Laboratories Annuity Retirement Plan | 19 | 711,874 | 0 | |||||||
| Abbott Laboratories Supplemental Pension Plan | 19 | 6,478,950 | 442,506 | (2) | |||||||
| L. D. Earnhardt | Abbott Laboratories Annuity Retirement Plan | 6 | 131,762 | 0 | |||||||
| Abbott Laboratories Supplemental Pension Plan | 6 | 904,252 | 0 | (2) | |||||||
| D. G. Salvadori | Abbott Laboratories Annuity Retirement Plan | 10 | 147,712 | 0 | |||||||
| Abbott Laboratories Supplemental Pension Plan | 10 | 1,063,534 | 71,594 | (2) | |||||||
| R. E. Funck, Jr. | Abbott Laboratories Annuity Retirement Plan | 37 | 1,572,496 | 0 | |||||||
| Abbott Laboratories Supplemental Pension Plan | 37 | 8,569,558 | 530,414 | (2) | |||||||
| (1) | Abbott calculates these present values using: (i) a 5.82% discount rate for the Annuity Retirement Plan and a 5.74% discount rate for the Supplemental Pension Plan, the same effective discount rates it uses for Financial Accounting Standards Board ASC Topic 715 calculations for financial reporting purposes; and (ii) each plan’s unreduced retirement age. The present values shown in the table reflect post-retirement mortality, based on the Financial Accounting Standards Board ASC Topic 715 assumption, but do not include a factor for pre-retirement termination, mortality, or disability. |
| (2) | Consistent with the distribution requirements of Internal Revenue Code Section 409A and its regulations, vested Supplemental Pension Plan benefits, to the extent not previously funded, were distributed to the participants’ individual grantor trusts and included in the participants’ income. Amounts held in the officer’s individual trust are expected to offset Abbott’s obligations to the officer under the plan. During 2024, the amounts shown, less applicable tax withholdings, were deposited in such individual trusts established by the named officers. Grantor trusts are described in greater detail in the section of the proxy statement captioned, “Compensation Discussion and Analysis—Benefits and Perquisites.” |
|
65 |
| POTENTIAL PAYMENTS UPON TERMINATION OR CHANGE IN CONTROL |
POTENTIAL PAYMENTS UPON TERMINATION—GENERALLY
Abbott does not have employment agreements with its named officers.
The following summarizes the payments that the named officers, other than Mr. Funck, Jr., would have received if their employment had terminated on December 31, 2024. Earnings would have continued to be paid to the named officer’s Performance Incentive Plan, Management Incentive Plan, and Supplemental 401(k) Plan grantor trusts, until the trust assets were fully distributed. The amount of these payments would depend on the period over which the trusts’ assets were distributed and the trusts’ earnings. If the trusts’ assets were distributed over a ten-year period and based on current earnings, the named officers would receive the following average annual payments over such ten-year period:
| ● | R. B. Ford, $971,230 |
| ● | P. P. Boudreau, $43,834 |
| ● | H. L. Allen, $633,423 |
| ● | L. D. Earnhardt, $147,533 |
| ● | D. G. Salvadori, $205,365 |
In addition, the following one-time deposits would have been made under the Abbott Laboratories Supplemental Pension Plan for the following named officers:
| ● | R. B. Ford, $1,951,929 |
| ● | P. P. Boudreau, $595,762 |
| ● | H. L. Allen, $249,483 |
| ● | L. D. Earnhardt, $624,170 |
| ● | D. G. Salvadori, $64,670 |
If the termination of employment was due to disability, then the following named officers also would have received, in addition to Abbott’s standard disability benefits, a monthly long-term disability benefit in the amount of:
| ● | R. B. Ford, $143,063 |
| ● | P. P. Boudreau, $61,235 |
| ● | H. L. Allen, $54,735 |
| ● | L. D. Earnhardt, $62,460 |
| ● | D. G. Salvadori, $42,770 |
This long-term disability benefit would continue for up to 24 months following termination of employment. It ends if the officer retires, recovers, dies, or ceases to meet eligibility criteria.
In addition, if the employment of these named officers had terminated due to death or disability, the officer’s unvested stock options and restricted shares would have vested on December 31, 2024 with values as set forth below in the section captioned, “Equity Awards.”
| 66 | |
POTENTIAL PAYMENTS UPON CHANGE IN CONTROL
Abbott has change in control arrangements with other key members of its management team, in the form of change in control agreements for Abbott officers and a change in control plan for certain other management personnel. The agreements with the named officers are described below.
Each change in control agreement continues in effect until December 31, 2026, and can be renewed for successive two-year terms upon notice prior to the expiration date. If notice of non-renewal is given, the agreement will expire on the later of the scheduled expiration date and the one-year anniversary of the date of such notice. If no notice is given, the agreement will expire on the one-year anniversary of the scheduled expiration date. Each agreement also automatically extends for two years following any change in control (see below) that occurs while the agreement is in effect.
The agreements provide that if the officer is terminated other than for cause or permanent disability or if the officer elects to terminate employment for good reason (see below) within two years following a change in control of Abbott, the officer is entitled to receive a lump sum payment equal to three times the officer’s annual salary and annual incentive (“bonus”) award (assuming for this purpose that all target performance goals have been achieved or, if higher, based on the average bonus for the last three years), plus any unpaid bonus owing for any completed performance period and the pro rata bonus for any current bonus period (based on the highest of the bonus assuming achievement of target performance, the average bonus for the past three years, or in the case of the unpaid bonus for any completed performance period, the actual bonus earned). If the officer is terminated other than for cause or permanent disability or if the officer elects to terminate employment for good reason during a potential change in control (see below), the officer is entitled to receive a lump sum payment of the annual salary and bonus payments described above, except that the amount of the bonus to which the officer is entitled will be based on the actual achievement of the applicable performance goals. If the potential change in control becomes a “change in control event” (within the meaning of Section 409A of the Internal Revenue Code), the officer will be entitled to receive the difference between the bonus amounts the officer received upon termination during the potential change in control and the bonus amounts that would have been received had such amounts instead been based on the higher of the officer’s target bonus or the average bonus paid to the officer in the preceding three years. Bonus payments include payments made under the Performance Incentive Plan. The officer will also receive up to three years of additional employee benefits (including welfare benefits, outplacement services and tax and financial counseling, and the value of three more years of pension accruals).
If change in control related payments and benefits become subject to the excise tax imposed under Section 4999 of the Internal Revenue Code, payments under the agreement will be reduced to prevent application of the excise tax if such a reduction would leave the executive in a better after-tax position than if the payments were not reduced and the tax applied. The agreements also limit the conduct for which awards under Abbott’s incentive stock programs can be terminated and generally permit options to remain exercisable for the remainder of their term.
For purposes of the agreements, the term “change in control” includes the following events: any person becoming the beneficial owner of Abbott securities representing a specified percentage of the outstanding voting power (not including an acquisition directly from Abbott and its affiliates); a change in the majority of the members of the Board of Directors whose appointment was approved by a vote of at least two thirds of the incumbent directors; and the consummation of certain mergers or similar corporate transactions involving Abbott. A “potential change in control” under the agreements includes, among other things, Abbott’s entry into an agreement that would result in a change in control. Finally, the term “good reason” includes: a significant adverse change in the executive’s position, duties, or authority; Abbott’s failure to pay the executive’s compensation or a reduction in the executive’s base pay or benefits; or the relocation of Abbott’s principal executive offices to a location that is more than thirty-five miles from the location of the offices at the time of the change in control.
|
67 |
If a change in control had occurred on December 31, 2024 immediately followed by one of the covered circumstances described above, the named officers, other than Mr. Funck, Jr., would have been entitled to receive the following payments and benefits under the change in control agreements:
| Name | Cash Termination Payments | Additional Supplemental Pension Plan Benefits | Welfare and Fringe Benefits | ||||||||
| R. B. Ford | $ | 15,706,150 | $ | 2,013,179 | $ | 109,788 | |||||
| P. P. Boudreau | 7,352,200 | 2,548,568 | 116,822 | ||||||||
| H. L. Allen | 6,814,200 | 1,655,355 | 59,120 | ||||||||
| L. D. Earnhardt | 7,054,200 | 730,166 | 109,355 | ||||||||
| D. G. Salvadori | 6,660,400 | 263,202 | 101,858 | ||||||||
EQUITY AWARDS
Under Abbott Laboratories’ Incentive Stock Programs, upon a change in control, the surviving company may assume, convert, or replace awards to executive officers on an equivalent basis. If the surviving company does not do so, then the awards vest. If the surviving company does assume, convert, or replace the awards on an equivalent basis, then the awards vest if the officer’s employment is terminated without cause or the officer resigns for good reason during the period six months prior to and through two years after a change in control. The term “good reason” has the same definition as in the change of control agreements.
If a change in control had occurred on December 31, 2024, and the surviving company did not assume, convert, or replace the awards, then the named officers, other than Mr. Funck, Jr., would have vested in the following options and restricted shares:
| Unvested Stock Options | Restricted Shares | ||||||||||
| Name | Number of Option Shares | Value
of Option Shares | Number of Restricted Shares |
Value
of Restricted Shares | |||||||
| R. B. Ford | 563,291 | $ | 1,264,458 | 141,668 | $ | 16,024,067 | |||||
| P. P. Boudreau | 114,414 | 155,385 | 29,790 | 3,369,547 | |||||||
| H. L. Allen | 147,488 | 333,216 | 37,007 | 4,185,862 | |||||||
| L. D. Earnhardt | 133,266 | 286,376 | 33,559 | 3,795,858 | |||||||
| D. G. Salvadori | 142,592 | 319,702 | 35,446 | 4,009,297 | |||||||
The value of stock options shown is based on the excess of the closing price of a common share on December 31, 2024 over the exercise price of such options, multiplied by the number of unvested stock options held by the named officer. The value of restricted shares shown is determined by multiplying the number of restricted shares that would vest as of December 31, 2024 and the closing price of a common share on December 31, 2024.
| 68 | |
| CEO PAY RATIO |
Abbott’s compensation programs are designed to attract and retain talented people around the world who share Abbott’s mission to help people live their healthiest possible lives. We use a consistent approach for determining compensation for our employees, including the CEO. However, compensation elements and pay levels of our employees can vary dramatically from country to country based on market trends, cost of living, and cost of labor. These factors, along with movement of the U.S. dollar against other currencies, can cause variation in median employee compensation and the resulting ratio.
As of October 1, 2024, Abbott employed 114,092 people, 68%1 of whom were employed outside of the U.S. To identify our median employee, we examined the 2024 base salary of all employees globally, excluding the CEO. We removed 4,929 employees2, representing less than 5% of our global workforce, in locations where the cost of living, cost of labor, or currency movement against the U.S. dollar was not representative of our global employee compensation arrangements. We annualized the base salary of all permanent employees who were hired in 2024 but did not work for the entire year. The base salary for employees outside of the U.S. was converted to U.S. dollars.
After identifying the median employee, we collected annual total compensation for this employee using the same methodology we use for our named executive officers as disclosed in the Summary Compensation Table on page 55 and then added the cost of medical and dental benefits ($15,813) in the calculation of annual total compensation for the median employee and CEO.
The annual total compensation of our median employee was $128,746, resulting in a ratio of 177:1.
The above ratio and annual total compensation amount are reasonable estimates that have been calculated using methodologies and assumptions permitted by SEC rules.
| 1 | Total U.S. employees: 36,529; total non-U.S. employees: 77,563. |
| 2 | Algeria (72), Hungary (4), Kazakhstan (164), Latvia (9), Malaysia (1,846), Pakistan (1,409), Philippines (1,392), Sri Lanka (4) and Tunisia (29). |
|
69 |
| PAY VERSUS PERFORMANCE |
The following table presents the Company’s pay versus performance disclosure as required by the SEC. The “Compensation Actually Paid” portions of this table are calculated in accordance with SEC rules and include certain amounts that were not received during the respective fiscal year and may not be received in the future. The section of the proxy statement captioned, “Compensation Discussion and Analysis—Basis for Compensation Decisions” describes how the Compensation Committee links pay to performance.
| Value of Initial Fixed $100 Investment Based On:(6) | ||||||||||||||||||||||||||||||||||||||||
| Year(1) | Summary Compensation Table Total for Ford(2) | Summary Compensation Table Total for White(2) | Compensation Actually Paid to Ford(3) | Compensation Actually Paid to White(4) | Average Summary Compensation Table Total for Non-PEO NEOs(2) | Average Compensation Actually Paid to Non-PEO NEOs(5) | Total Shareholder Return | Peer
Group Total Shareholder Return(7) | Net Income (in millions) | Adjusted Diluted EPS(8) | ||||||||||||||||||||||||||||||
| 2024 | $ | $ | $ | $ | $ | $ | $ | $ | ||||||||||||||||||||||||||||||||
| 2023 | $ | $ | $ | $ | $ | $ | $ | $ | ||||||||||||||||||||||||||||||||
| 2022 | $ | $ | $ | $ | $ | $ | $ | $ | ||||||||||||||||||||||||||||||||
| 2021 | $ | $ | $ | $ | $ | $ | $ | $ | ||||||||||||||||||||||||||||||||
| 2020 | $ | $ | $ | $ | $ | $ | $ | $ | $ | $ | ||||||||||||||||||||||||||||||
| (1) | The Principal Executive Officer (“PEO”) and named officers for the applicable years were as follows: | |
| ● | 2024: Robert B. | |
| ● | 2023: Robert B. | |
| ● | 2022: Robert B. | |
| ● | 2021: Robert B. | |
| ● | 2020: Mr. Ford served as President and
Chief Operating Officer until his appointment to President and Chief Executive Officer (PEO), effective March 31, 2020, and
Mr. | |
| (2) | Amounts reported in this column represent (i) the total compensation reported in the Summary Compensation Table for the applicable year in which the named officer served as PEO in the case of Messrs. Ford and White and (ii) the average of the total compensation reported in the Summary Compensation Table for the applicable year for the Company’s named officers other than the individual serving as PEO for all or a portion of such years. |
| 70 | |
| (3) | Amounts reported in this column are based on total compensation reported for Mr. Ford in the Summary Compensation Table for the indicated fiscal years and adjusted as shown in the table below. |
| Ford | |||||||||||||||||||||
| 2024 | 2023 | 2022 | 2021 | 2020 | |||||||||||||||||
| Summary Compensation Table - Total Compensation(a) | $ | $ | $ | $ | $ | ||||||||||||||||
| - | Change in Accumulated Benefits Under Defined Benefit and Actuarial Pension Plans(b) | ( | ) | ( | ) | ( | ) | ( | ) | ||||||||||||
| + | Service Costs Under Defined Benefit and Actuarial Pension Plans(c) | ||||||||||||||||||||
| - | Grant Date Fair Value of Option Awards and Stock Awards Granted in Fiscal Year(d) | ( | ) | ( | ) | ( | ) | ( | ) | ( | ) | ||||||||||
| + | Fair Value at Fiscal Year-End of Outstanding and Unvested Option Awards and Stock Awards Granted in Fiscal Year(e) | ||||||||||||||||||||
| + | Change in Fair Value of Outstanding and Unvested Option Awards and Stock Awards Granted in Prior Fiscal Years(f) | ( | ) | ||||||||||||||||||
| + | Change in Fair Value as of Vesting Date of Option Awards and Stock Awards Granted in Prior Fiscal Years For Which Applicable Vesting Conditions Were Satisfied During Fiscal Year(g) | ( | ) | ( | ) | ( | ) | ||||||||||||||
| + | Dividends paid on equity awards(h) | ||||||||||||||||||||
| = | Compensation Actually Paid | $ | $ | $ | $ | $ | |||||||||||||||
| (a) | Represents Total Compensation as reported in the Summary Compensation Table for the indicated fiscal year. |
| (b) | Represents the aggregate change in the actuarial present value of Mr. Ford’s accumulated benefit under all defined benefit and actuarial pension plans reported in the Summary Compensation Table for the indicated fiscal year. |
| (c) | Represents the sum of the actuarial present value of Mr. Ford’s benefit under all defined benefit and actuarial pension plans attributable to services rendered during the indicated fiscal year, calculated using the same methodology as used in the Company’s financial statements under generally accepted accounting principles. |
| (d) | Represents the aggregate grant date fair value of option awards and stock awards granted to Mr. Ford reported in the Summary Compensation Table during the indicated fiscal year, computed in accordance with the Company’s methodology used for financial reporting purposes. |
| (e) | Represents the aggregate fair value as of the indicated fiscal year-end of Mr. Ford’s outstanding and unvested option awards and stock awards granted during such fiscal year, computed in accordance with the Company’s methodology used for financial reporting purposes. |
| (f) | Represents the aggregate change in fair value during the indicated fiscal year of the outstanding and unvested option awards and stock awards granted in prior fiscal years and held by Mr. Ford as of the last day of the indicated fiscal year, computed in accordance with the Company’s methodology used for financial reporting purposes. |
| (g) | Represents the aggregate change in fair value, measured from the prior fiscal year-end to the vesting date, of each option award and stock award held by Mr. Ford that was granted in a prior fiscal year and which vested during the indicated fiscal year, computed in accordance with the Company’s methodology used for financial reporting purposes. |
| (h) | Represents the aggregate value of dividends paid on outstanding and unvested stock awards. |
|
71 |
| (4) | Amounts reported in this column are based on total compensation reported for Mr. White in the Summary Compensation Table for the indicated fiscal year and adjusted as shown in the table below. Mr. White was a named officer in 2021, and his 2021 compensation is included in the average compensation reported for the Company’s other named officers, as described in footnote 5 below. |
| White 2020 | |||||
| Summary Compensation Table - Total Compensation(a) | $ | ||||
| - | Change in Accumulated Benefits Under Defined Benefit and Actuarial Pension Plans(b) | ( | ) | ||
| + | Service Costs Under Defined Benefit and Actuarial Pension Plans(c) | ||||
| - | Grant Date Fair Value of Option Awards and Stock Awards Granted in Fiscal Year(d) | ( | ) | ||
| + | Fair Value at Fiscal Year-End of Outstanding and Unvested Option Awards and Stock Awards Granted in Fiscal Year(e) | ||||
| + | Change in Fair Value of Outstanding and Unvested Option Awards and Stock Awards Granted in Prior Fiscal Years(f) | ||||
| + | Change in Fair Value as of Vesting Date of Option Awards and Stock Awards Granted in Prior Fiscal Years For Which Applicable Vesting Conditions Were Satisfied During Fiscal Year(g) | ( | ) | ||
| + | Dividends paid on equity awards(h) | ||||
| = | Compensation Actually Paid | $ | |||
| (a) | Represents Total Compensation as reported in the Summary Compensation Table for the indicated fiscal year. |
| (b) | Represents the aggregate change in the actuarial present value of Mr. White’s accumulated benefit under all defined benefit and actuarial pension plans reported in the Summary Compensation Table for the indicated fiscal year. |
| (c) | Represents the sum of the actuarial present value of Mr. White’s benefit under all defined benefit and actuarial pension plans attributable to services rendered during the indicated fiscal year, calculated using the same methodology as used in the Company’s financial statements under generally accepted accounting principles. |
| (d) | Represents the aggregate grant date fair value of option awards and stock awards granted to Mr. White reported in the Summary Compensation Table during the indicated fiscal year, computed in accordance with the Company’s methodology used for financial reporting purposes. |
| (e) | Represents the aggregate fair value as of the indicated fiscal year-end of Mr. White’s outstanding and unvested option awards and stock awards granted during such fiscal year, computed in accordance with the Company’s methodology used for financial reporting purposes. |
| (f) | Represents the aggregate change in fair value during the indicated fiscal year of the outstanding and unvested option awards and stock awards granted in prior fiscal years and held by Mr. White as of the last day of the indicated fiscal year, computed in accordance with the Company’s methodology used for financial reporting purposes. |
| (g) | Represents the aggregate change in fair value, measured from the prior fiscal year-end to the vesting date, of each option award and stock award held by Mr. White that was granted in a prior fiscal year and which vested during the indicated fiscal year, computed in accordance with the Company’s methodology used for financial reporting purposes. |
| (h) | Represents the aggregate value of dividends paid on outstanding and unvested stock awards. |
| 72 | |
| (5) | Amounts reported in this column are based on the average total compensation reported for the Company’s named officers other than the individuals serving as PEO in the Summary Compensation Table for the indicated fiscal year and adjusted as shown in the table below: |
| Other NEOs Average(a) | |||||||||||||||||||||
| 2024 | 2023 | 2022 | 2021 | 2020 | |||||||||||||||||
| Summary Compensation Table - Total Compensation(b) | $ | $ | $ | $ | $ | ||||||||||||||||
| - | Change in Accumulated Benefits Under Defined Benefit and Actuarial Pension Plans(c) | ( | ) | ( | ) | ( | ) | ( | ) | ||||||||||||
| + | Service Costs Under Defined Benefit and Actuarial Pension Plans(d) | ||||||||||||||||||||
| - | Grant Date Fair Value of Option Awards and Stock Awards Granted in Fiscal Year(e) | ( | ) | ( | ) | ( | ) | ( | ) | ( | ) | ||||||||||
| + | Fair Value at Fiscal Year-End of Outstanding and Unvested Option Awards and Stock Awards Granted in Fiscal Year(f) | ||||||||||||||||||||
| + | Change in Fair Value of Outstanding and Unvested Option Awards and Stock Awards Granted in Prior Fiscal Years(g) | ( | ) | ||||||||||||||||||
| + | Change in Fair Value as of Vesting Date of Option Awards and Stock Awards Granted in Prior Fiscal Years For Which Applicable Vesting Conditions Were Satisfied During Fiscal Year(h) | ( | ) | ( | ) | ( | ) | ||||||||||||||
| + | Dividends paid on equity awards(i) | ||||||||||||||||||||
| = | Compensation Actually Paid | $ | $ | $ | $ | $ | |||||||||||||||
| (a) | Please see footnote 1 for the named officers included in the average for each indicated fiscal year. Mr. White was a named officer in 2021, and his 2021 compensation is included in the average compensation reported in this table for 2021. |
| (b) | Represents the average Total Compensation as reported in the Summary Compensation Table for the reported named officers in the indicated fiscal year. |
| (c) | Represents the average aggregate change in the actuarial present value of the reported named officers accumulated benefit under all defined benefit and actuarial pension plans reported in the Summary Compensation Table for the indicated fiscal year. |
| (d) | Represents the average sum of the actuarial present value of the reported named officers benefit under all defined benefit and actuarial pension plans attributable to services rendered during the indicated fiscal year, calculated using the same methodology as used in the Company’s financial statements under generally accepted accounting principles. |
| (e) | Represents the average aggregate grant date fair value of the option awards and stock awards granted to the reported named officers reported in the Summary Compensation Table during the indicated fiscal year, computed in accordance with the Company’s methodology used for financial reporting purposes. |
| (f) | Represents the average aggregate fair value as of the indicated fiscal year-end of the reported named officers outstanding and unvested option awards and stock awards granted during such fiscal year, computed in accordance with the Company’s methodology used for financial reporting purposes. |
| (g) | Represents the average aggregate change in fair value during the indicated fiscal year of the outstanding and unvested option awards and stock awards granted in prior fiscal years and held by the reported named officers as of the last day of the indicated fiscal year, computed in accordance with the Company’s methodology used for financial reporting purposes. |
|
73 |
| (h) | Represents the average aggregate change in fair value, measured from the prior fiscal year-end to the vesting date, of each option award and stock award held by the reported named officers that was granted in a prior fiscal year and which vested during the indicated fiscal year, computed in accordance with the Company’s methodology used for financial reporting purposes. |
| (i) | Represents the average aggregate value of dividends paid on outstanding and unvested stock awards held by the reported named officers during the indicated fiscal year. |
| (6) | Pursuant to rules of the SEC, the comparison assumes $100 was invested on December 31, 2019 in our common stock. Historic stock price performance is not necessarily indicative of future stock price performance. |
| (7) | The TSR Peer Group consists of the Standard & Poor’s 500 Health Care Index, an independently prepared index that includes companies in the healthcare industry. |
| (8) |
We believe the compensation paid, calculated in accordance with SEC disclosure rules, in each of the years reported above and over the five-year cumulative period are reflective of the Compensation Committee’s emphasis on “pay-for-performance” as the compensation paid fluctuated year-over-year. However, these relationships are primarily due to the result of our stock performance and our varying levels of achievement against pre-established performance goals under our annual incentive plan and our LTI plan, including our TSR and Adjusted Diluted EPS performance. The section of the proxy statement captioned, “Compensation Discussion and Analysis—Basis for Compensation Decisions” describes in greater detail the Compensation Committee’s emphasis on “pay-for-performance”. The relationship between compensation paid and the pay of our NEOs is described below:
| - | Relationship Between Compensation Paid to the PEO and Average Other Named Officers and the Company’s Net Income – In 2021, the compensation paid to Mr. Ford and the other named officers increased by 49% and 87%, respectively, compared to a 57% increase in our net income. In 2022, the compensation paid to Mr. Ford and the other named officers decreased by 82% and 86%, respectively, compared to a 2.0% decrease in our net income. In 2023, the compensation paid to Mr. Ford and the other named officers increased by 156% and 96%, respectively, compared to a 17.5% decrease in our net income. In 2024, the compensation paid to Mr. Ford and the other named officers increased by 20% and 36%, respectively, compared to a 134.2% increase in our net income. For 2020, the year in which Mr. Ford served as PEO for a portion of the year, the compensation paid to Mr. Ford was $29,075,377 compared to our net income of $4.495 billion. For 2020, the year in which Mr. White served as PEO for a portion of the year, the compensation paid to Mr. White was $38,385,988 compared to our net income of $4.495 billion. |
| 74 | |
| - | Relationship Between Compensation Paid to the PEO and Average Other Named Officers and the Company’s Adjusted Diluted EPS Performance – In 2021, the compensation paid to Mr. Ford and the other named officers increased by 49% and 87%, respectively, compared to a 43% increase in our Adjusted Diluted EPS, as calculated per footnote 8 above. In 2022, the compensation paid to Mr. Ford and the other named officers decreased by 82% and 86%, respectively, compared to a 2.5% increase in our Adjusted Diluted EPS, as calculated per footnote 8 above. In 2023, the compensation paid to Mr. Ford and the other named officers increased by 156% and 96%, respectively, compared to a 16.9% decrease in our Adjusted Diluted EPS, as calculated per footnote 8 above. In 2024, the compensation paid to Mr. Ford and the other named officers increased by 20% and 36%, respectively, compared to a 5.2% increase in our Adjusted Diluted EPS, as calculated per footnote 8 above. For 2020, the year in which Mr. Ford served as PEO for a portion of the year, the compensation paid to Mr. Ford was $29,075,377 compared to our Adjusted Diluted EPS of $3.65, as calculated per footnote 8 above, over the same time horizon. For 2020, the year in which Mr. White served as PEO for a portion of the year, the compensation paid to Mr. White was $38,385,988 compared to our Adjusted Diluted EPS of $3.65, as calculated per footnote 8 above, over the same time horizon. |
Our compensation program is linked directly to our business strategy, to help focus participants on those activities that drive our business strategy and create value for shareholders.
The following list includes the most important performance measures used to link the compensation of our named officers for the most recently completed fiscal year to Company performance and business strategy. Please see page 34 of the CD&A for additional detail.
| ● | ● | ||
| ● | ● | ||
| ● | ● | ||
| ● | ● |
|
75 |
RATIFICATION OF ERNST & YOUNG LLP AS AUDITORS
(ITEM 2 ON PROXY CARD)
Abbott’s By-Laws provide that the Audit Committee shall appoint annually a firm of independent registered public accountants to serve as auditors. In October 2024, the Audit Committee appointed Ernst & Young LLP to act as auditors for 2025. Ernst & Young LLP has served as Abbott’s auditors since 2014.
Although the Audit Committee has sole authority to appoint auditors, it would like to know the opinion of the shareholders regarding its appointment of Ernst & Young LLP as auditors for 2025. For this reason, shareholders are being asked to ratify this appointment. If the shareholders do not ratify the appointment of Ernst & Young LLP as auditors for 2025, the Audit Committee will take that fact into consideration, but may, nevertheless, continue to retain Ernst & Young LLP.
The Board of Directors recommends a vote FOR ratification of the appointment of Ernst & Young LLP as auditors for 2025.
Representatives of Ernst & Young LLP are expected to be present at the Annual Meeting and will be given the opportunity to make a statement if they desire to do so. They will also be available to respond to appropriate questions.
AUDIT FEES AND NON-AUDIT FEES
The following table presents fees for professional audit services by Ernst & Young LLP for the audit of Abbott’s annual financial statements for the years ended December 31, 2024 and December 31, 2023 and fees billed for other services rendered by Ernst & Young LLP during these periods.
| 2024 | 2023 | |||||||
| Audit fees:(1) | $ | 30,854,000 | $ | 27,050,000 | ||||
| Audit related fees:(2) | 1,574,000 | 1,403,000 | ||||||
| Tax fees:(3) | 6,241,000 | 7,304,000 | ||||||
| All other fees:(4) | 242,000 | 331,000 | ||||||
| Total | $ | 38,911,000 | $ | 36,088,000 | ||||
| (1) | Audit fees include amounts billed or to be billed for professional services rendered for the audit of Abbott’s annual financial statements, the review of Abbott’s financial statements included in Abbott’s quarterly reports, and the audits of Abbott’s internal control over financial reporting, statutory and subsidiary audits, the review of documents filed with the Securities and Exchange Commission, and certain accounting consultations in connection with the audits. |
| (2) | Audit related fees include audits of certain employee benefit plans’ financial statements, assurance reports related to certain information technology systems, and other agreed upon procedures. |
| (3) | Tax fees consist principally of professional services rendered for tax compliance and tax planning and advice including assistance with tax audits and appeals. |
| (4) | All other fees include regulatory and technical education services, participation in industry surveys, benchmarking analyses, and a required compliance assessment associated with Abbott’s hosting of certain health data. |
| 76 | |
POLICY ON AUDIT COMMITTEE PRE-APPROVAL OF AUDIT AND PERMISSIBLE NON-AUDIT SERVICES OF THE INDEPENDENT AUDITOR
The Audit Committee has established policies and procedures to pre-approve all audit and permissible non-audit services performed by the independent auditor and its related affiliates.
Prior to engagement of the independent registered public accounting firm for the next year’s audit, management will submit a schedule of all proposed services expected to be rendered during that year for each of four categories of services to the Audit Committee for approval.
Prior to engagement, the Audit Committee pre-approves these services by category of service. The fees are budgeted and the Audit Committee requires the independent registered public accounting firm and management to report actual fees versus the budget periodically by category of service. During the year, circumstances may arise when it may become necessary to engage the independent registered public accounting firm for additional services not contemplated in the original pre-approval. In those instances, the Audit Committee requires specific pre-approval before engaging the independent registered public accounting firm.
The Audit Committee may delegate pre-approval authority to one or more of its members. The member to whom such authority is delegated must report any pre-approval decisions to the Audit Committee at its next scheduled meeting.
| REPORT OF THE AUDIT COMMITTEE |
Management is responsible for Abbott’s internal controls and the financial reporting process. The independent registered public accounting firm is responsible for performing an audit of the consolidated financial statements and expressing an opinion on the conformity of those financial statements with accounting principles generally accepted in the United States of America, as well as expressing an opinion on the effectiveness of internal control over financial reporting. The Audit Committee reviews these processes on behalf of the Board of Directors. In this context, the Audit Committee has reviewed and discussed the audited financial statements contained in the 2024 Annual Report on Form 10-K with Abbott’s management and its independent registered public accounting firm.
The Audit Committee has discussed with the independent registered public accounting firm the matters required to be discussed by the applicable requirements of the Public Company Accounting Oversight Board and the Securities and Exchange Commission.
The Audit Committee has received the written disclosures and the letter from the independent registered public accounting firm required by the applicable requirements of the Public Company Accounting Oversight Board regarding the independent registered public accounting firm’s communications with the Audit Committee concerning independence, and has discussed with the independent registered public accounting firm the firm’s independence. The Audit Committee has also considered whether the provision of the services described on page 76 under the caption “Audit Fees and Non-Audit Fees” is compatible with maintaining the independence of the independent registered public accounting firm.
Based on the review and discussions referred to above, the Audit Committee recommended to the Board of Directors that the audited financial statements be included in Abbott’s Annual Report on Form 10-K for the year ended December 31, 2024 filed with the Securities and Exchange Commission.
Audit Committee
N. McKinstry, Chair
C. Babineaux-Fontenot
P. Gonzalez
M. A. Kumbier
J. G. Stratton
|
77 |
SAY ON PAY—AN ADVISORY VOTE ON THE APPROVAL OF EXECUTIVE COMPENSATION (ITEM 3 ON PROXY CARD)
Shareholders are being asked to approve the compensation of Abbott’s named officers, as disclosed under Securities and Exchange Commission rules, including the Compensation Discussion and Analysis, the compensation tables, and related material included in this proxy statement.
Abbott’s strong sustainable performance has resulted in total shareholder return (TSR) above the peer group median on a one-year and five-year basis.
On a one-year basis, our TSR performance placed us at the 58th percentile relative to our peers and on a five-year basis, our TSR performance placed us at the 68th percentile relative to our peers. These consistent top-tier returns are driven by strong execution, an effective governance structure, and the strength of our diversified business model with leadership positions in some of the largest and fastest-growing markets in healthcare and innovative product portfolios across our businesses.
| 1-Year Total Shareholder Return | 5-Year Total Shareholder Return | ||||
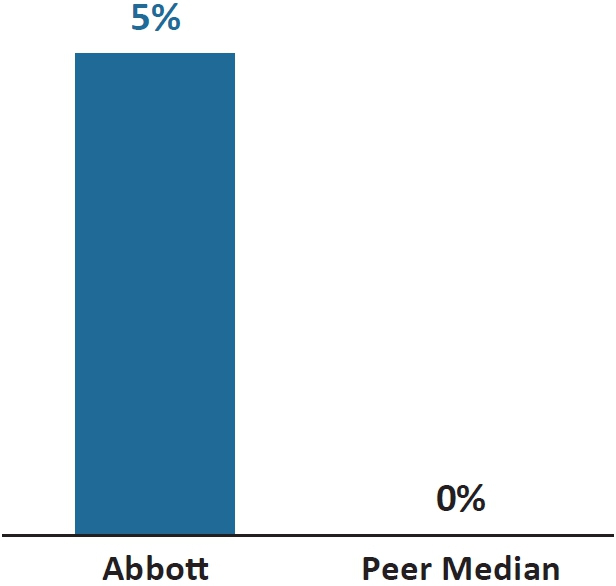 |
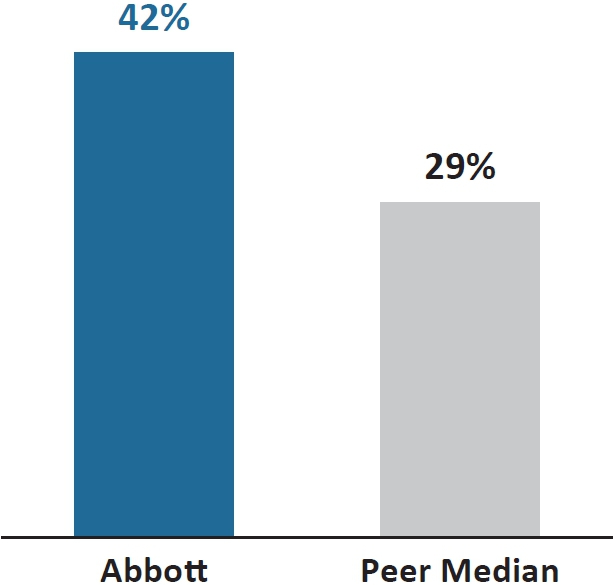 |
Abbott’s three-year TSR performance reflects our significant contributions to the fight against COVID-19. During 2022, which represents the starting point for three-year TSR measurement, we delivered $8.4 billion in COVID test sales. As the COVID pandemic shifted to an endemic state, in part due to the readily available testing produced by Abbott and other companies, the demand for testing declined and negatively impacted TSR. We are proud of how our company rose to the challenge during that troubling time. Extraordinary events, such as COVID, demonstrate why an over reliance on one fixed time-frame TSR measurement does not represent a complete picture of company performance.
In addition to delivering significant shareholder returns, Abbott continued to take important steps to position the Company for long-term, sustainable growth.
| ROBUST INNOVATION PIPELINE | INVESTING FOR FUTURE GROWTH | SHAREHOLDER RETURNS | ||
| ● Steady cadence of important product approvals across our businesses that will be significant contributors to growth in the coming years. This includes first-of-its-kind technology like TriClip® and Aveir® along with our continuous glucose monitoring systems. | ● Increased manufacturing scale and capabilities across several important products. ● Invested $2.2 billion in capital projects in the past year. |
● Returned $5.1 billion to shareholders in 2024 and announced a 7.3% increase to our dividend for 2025, marking our 53rd consecutive year of dividend increases. | ||
| 78 | |
Our compensation program is market-based and produces outcomes that directly link to both Company and officer performance. The vast majority of compensation for our executive officers is performance-based and objectively determined. Long Term Incentives (LTI), which comprise the largest percentage of compensation for our executive officers, are directly linked to shareholder returns. Our annual incentive plan links officer compensation to the metrics which ensure financial success for the short-term and position the Company for growth in the future as well.
The Compensation Committee, with the counsel of its independent consultant, concluded that the compensation reported herein was earned and appropriate. The specific details of the executive compensation program and compensation paid to the named executive officers are described on pages 27 through 52 of this proxy statement.
While this vote is advisory and non-binding, the Board of Directors and Compensation Committee value the opinion of the shareholders and will review the voting results and take into account the results and our ongoing dialogue with shareholders when future compensation decisions are made.
Accordingly, the Board of Directors recommends that you vote FOR the approval of the named officers’ compensation.
|
79 |
ADDITIONAL INFORMATION
| SECURITY OWNERSHIP OF EXECUTIVE OFFICERS AND DIRECTORS |
The table below reflects the number of Abbott common shares beneficially owned as of January 31, 2025 by (i) each director nominee, (ii) the Chief Executive Officer, the Chief Financial Officer, and the other current and former executive officers listed in the Summary Compensation Table, and (iii) all directors and executive officers as a group. It also reflects the number of stock equivalent units held by non-employee directors under the Abbott Laboratories Non-Employee Directors’ Fee Plan and restricted stock units held by non-employee directors.
| Name | Shares Beneficially Owned(1)(2) |
Stock
Options Exercisable Within 60 Days of January 31, 2025 |
Stock Equivalent Units | |||
| H. L. Allen | 184,806 | 949,613 | 0 | |||
| R. J. Alpern | 39,163 | 0 | 9,988 | |||
| C. Babineaux-Fontenot | 3,682 | 0 | 0 | |||
| S. E. Blount | 35,023 | 0 | 0 | |||
| P. P. Boudreau | 39,324 | 124,583 | 0 | |||
| L. D. Earnhardt | 61,462 | 421,036 | 0 | |||
| R. B. Ford | 417,462 | 2,291,243 | 0 | |||
| R. E. Funck, Jr. | 270,887 | 787,905 | 0 | |||
| P. Gonzalez | 5,284 | 0 | 4,125 | |||
| M. A. Kumbier | 14,079 | 0 | 0 | |||
| D. W. McDew | 8,757 | 0 | 0 | |||
| N. McKinstry | 37,089 | 81,668 | 0 | |||
| M. G. O’Grady | 3,682 | 8,980 | 0 | |||
| M. F. Roman | 6,843 | 0 | 4,670 | |||
| D. G. Salvadori | 125,697 | 879,098 | 0 | |||
| D. J. Starks | 6,727,440 | 13,413 | 0 | |||
| J. G. Stratton | 17,398 | 0 | 11,650 | |||
| All directors and executive officers as a group(3) | 7,937,404 | 5,527,204 | 30,433 |
| (1) | This column includes shares held in the officers’ accounts in the Abbott Laboratories Stock Retirement Trust as follows: P. P. Boudreau, 358; R. E. Funck, Jr., 19,046; and all executive officers as a group, 11,984. Each officer has shared voting power and sole investment power with respect to the shares held in his or her account. |
| (2) | This column includes restricted stock units held by the non-employee directors and payable in stock upon their retirement from the Board as follows: R. J. Alpern, 39,163; C. Babineaux-Fontenot, 3,682; S. E. Blount, 32,423; P. Gonzalez, 5,284; M. A. Kumbier, 10,998; D. W. McDew, 8,757; N. McKinstry, 32,423; M. G. O’Grady, 3,682; M. F. Roman, 6,783; D. J. Starks, 17,380; J. G. Stratton, 13,943; and all directors as a group, 174,518. |
| (3) | None of the directors or executive officers have pledged shares. No director or executive officer beneficially owns more than one percent of the outstanding shares of Abbott. The directors and executive officers as a group beneficially own less than one percent of the outstanding shares of Abbott. |
| 80 | |
| INFORMATION CONCERNING SECURITY OWNERSHIP |
The table below reports the most recently reported number of common shares beneficially owned by BlackRock, Inc. and The Vanguard Group (directly or through their subsidiaries), the only persons known to Abbott to beneficially own more than 5% of Abbott’s outstanding common shares.
| Name and Address of Beneficial Owner | Shares Beneficially Owned |
Percent
of Class | ||
| BlackRock, Inc.(1) 50 Hudson Yards New York, NY 10001 |
134,061,311 | 7.7% | ||
| The Vanguard Group(2) 100 Vanguard Blvd. Malvern, PA 19355 |
156,444,700 | 9.01% |
| (1) | The information shown was provided by BlackRock, Inc. in a Schedule 13G/A it filed with the Securities and Exchange Commission on January 26, 2024. BlackRock reported that it has sole voting power over 120,538,358 of these shares and sole dispositive power over all of these shares. |
| (2) | The information shown was provided by The Vanguard Group in a Schedule 13G/A it filed with the Securities and Exchange Commission on February 13, 2024. Vanguard reported that it has shared voting power over 2,168,997 of these shares, sole dispositive power over 149,127,641 of these shares, and shared dispositive power over 7,317,059 of these shares. |
| APPROVAL PROCESS FOR RELATED PERSON TRANSACTIONS |
It is Abbott’s policy that the Nominations and Governance Committee oversee, review, and approve any transaction in which Abbott participates and in which any related person has a direct or indirect material interest if such transaction involves or is expected to involve payments of $120,000 or more in the aggregate per fiscal year. Related person transactions requiring review by the Nominations and Governance Committee pursuant to this policy are identified in:
| ● | Questionnaires annually distributed to Abbott’s directors and officers, |
| ● | Certifications submitted annually by Abbott officers related to their compliance with Abbott’s Code of Business Conduct, or |
| ● | Communications made directly by the related person to the Chief Financial Officer or General Counsel. |
In determining whether to approve a related person transaction, the Nominations and Governance Committee will consider the following items, among others:
| ● | The related person’s relationship to Abbott and interest in the transaction, |
| ● | The material facts of the transaction, including the aggregate value of such transaction or, in the case of indebtedness, the amount of principal involved, |
| ● | The benefits to Abbott of the transaction, |
| ● | If applicable, the availability of other sources of comparable products or services, |
| ● | An assessment of whether the transaction is on terms that are comparable to the terms available to an unrelated third party or to employees generally, |
| ● | Whether a transaction has the potential to impair director independence, and |
| ● | Whether the transaction constitutes a conflict of interest. |
|
81 |
This process is included in the Nominations and Governance Committee’s written charter, which is available in the corporate governance section of Abbott’s investor relations website (www.abbottinvestor.com). In 2024, an Abbott employee became the son-in-law of one of Abbott’s directors, Sally E. Blount, Ph.D. During 2024, his total compensation exceeded the foregoing threshold.
| OTHER MATTERS |
In accordance with Abbott’s articles of incorporation, Abbott has advanced defense costs on behalf of the Board of Directors and certain officers and employees in connection with a derivative action regarding Abbott’s manufacturing of certain infant powder formula products.
| DATE FOR RECEIPT OF SHAREHOLDER PROPOSALS FOR THE 2026 ANNUAL MEETING PROXY STATEMENT |
Shareholder proposals for presentation at the 2026 Annual Meeting must be received by Abbott no later than November 14, 2025 and must otherwise comply with the applicable requirements of the Securities and Exchange Commission to be considered for inclusion in the proxy statement and proxy for the 2026 meeting.
| PROCEDURE FOR RECOMMENDATION AND NOMINATION OF DIRECTORS AND TRANSACTION OF BUSINESS AT ANNUAL MEETING |
Proxy Access: A shareholder, or a group of up to 20 shareholders, owning continuously for at least three years Abbott common shares representing an aggregate of at least 3% of the voting power entitled to vote in the election of directors, may nominate and have included in Abbott’s proxy materials director nominees constituting up to 20% of the Board, provided that the shareholder(s) and the nominee(s) satisfy the requirements in Abbott’s By-Laws.
Nominating shareholders are permitted to include in Abbott’s proxy statement a 500-word statement in support of their nominee(s). Abbott may omit any information or statement that it, in good faith, believes is materially false or misleading, omits to state a material fact, or would violate any applicable law or regulation.
Other Nominations of Directors or Proposals to Transact Business: A shareholder may also recommend persons as potential nominees for director by submitting the names of such persons in writing to the Chair of the Nominations and Governance Committee or the Secretary of Abbott. Recommendations should be accompanied by a statement of qualifications and confirmation of the person’s willingness to serve. A nominee who is recommended by a shareholder following these procedures will receive the same consideration as other comparably qualified nominees.
A shareholder entitled to vote for the election of directors at an Annual Meeting and who is a shareholder of record at the time of the giving of notice provided for under Article II of Abbott’s By-Laws, through the date of the Annual Meeting, may directly nominate persons for director, or make proposals of other business to be brought before the Annual Meeting, by providing proper timely written notice to the Secretary of Abbott.
Notice Requirements: The notice submitted by a shareholder must include certain information required by Article II of Abbott’s By-Laws, including information about the shareholder, any person directly or indirectly controlling, controlled by or under common control with such shareholder, any beneficial owner of Abbott shares owned of record by such shareholder, certain other associated persons, their respective affiliates or associates, others acting in concert with them or participants with respect to any proposed business or nominations, and any proposed director nominee.
| 82 | |
For each matter the shareholder proposes to bring before the Annual Meeting, the notice must also include a brief description of the business to be discussed, the reasons for conducting such business at the Annual Meeting, and certain other information specified in the By-Laws. In addition, in the case of a director nomination, including through proxy access, the notice must include a written questionnaire with respect to the background and qualifications of the proposed nominee, a written representation and agreement of the proposed nominee addressing matters specified in the By-Laws, and certain other information specified in the By-Laws.
To be timely, written notice either to directly nominate persons for director, including through proxy access, or to bring business properly before the Annual Meeting must be received at Abbott’s principal executive offices not later than the close of business on the ninetieth day, or earlier than the one hundred twentieth day, prior to the anniversary date of the preceding Annual Meeting. If the Annual Meeting is called for a date that is more than thirty days prior to or more than sixty days after such anniversary date, notice by the shareholder must be received not earlier than the one hundred twentieth day prior to such Annual Meeting and not later than the close of business on the later of (i) the ninetieth day prior to such Annual Meeting and (ii) the tenth day following the day on which public announcement was made. To be timely for the 2026 Annual Meeting, this written notice must be received by Abbott no later than the close of business on January 25, 2026.
In addition, the notice must be updated and supplemented, if necessary, so that the information provided or required to be provided is true and correct (i) as of the record date for the Annual Meeting and (ii) as of the date that is ten business days prior to the meeting. Any such update or supplement must be received by the Secretary of Abbott at Abbott’s principal executive offices (A) not later than the close of business five business days after the record date for determining the shareholders entitled to receive notice of such meeting (in the case of an update required to be made under clause (i) of the foregoing sentence) and (B) not later than the close of business seven business days prior to the date of the Annual Meeting or, if practicable, any postponement, rescheduling or adjournment thereof (and, if not practicable, on the first practicable date prior to the date to which the Annual Meeting has been postponed, rescheduled or adjourned) (in the case of an update required to be made pursuant to clause (ii) of the foregoing sentence)), and must also meet the other requirements set forth in the By-Laws.
In addition to satisfying the foregoing requirements under Abbott’s By-Laws, to comply with the universal proxy rules, shareholders who intend to solicit proxies in support of director nominees other than Abbott’s nominees must provide notice that sets forth the information required by Rule 14a-19 under the Securities Exchange Act of 1934, as amended. For the purposes of Rule 14a-19, the Board’s role in terms of including a shareholder nominee on the proxy card is to ensure the shareholder nominee is eligible based on the requirements specified in the By-Laws, not the nominee’s suitability to serve on the Board.
| GENERAL |
It is important that proxies be returned promptly. Shareholders are urged, regardless of the number of shares owned, to vote their shares. Most of Abbott’s shareholders may vote their shares by telephone or using the Internet. Shareholders who wish to vote by mail should sign and return their proxy card in the enclosed business reply envelope. Shareholders who vote by telephone or the Internet do not need to return their proxy card.
The 2025 Annual Meeting will be held virtually. Please see pages 84 and 85 for information on how to attend and participate in the Annual Meeting.
By order of the Board of Directors.
HUBERT L. ALLEN
Secretary
|
83 |
INFORMATION ABOUT THE ANNUAL MEETING
NOTICE AND ACCESS
In accordance with the Securities and Exchange Commission’s “Notice and Access” rules, Abbott mailed a Notice of Internet Availability of Proxy Materials (the “Notice”) to certain shareholders in mid-March of 2025. The Notice describes the matters to be considered at the Annual Meeting and how the shareholders can access the proxy materials online. It also provides instructions on how those shareholders can vote their shares. If you received the Notice, you will not receive a print version of the proxy materials, unless you request one. If you would like to receive a print version of the proxy materials, free of charge, please follow the instructions on the Notice.
HOW TO ATTEND THE MEETING ON THE VIRTUAL MEETING PLATFORM
Shareholders can attend, vote their shares, and submit questions during the Annual Meeting at meetnow.global/ABT2025. The Annual Meeting will begin promptly at 9:00 a.m. Central Time on April 25, 2025.
To be admitted to the Annual Meeting, shareholders will be required to enter a control number.
Registered Shareholders. If you are a registered holder (i.e., you received your proxy materials from Abbott through Abbott’s transfer agent, Computershare), you may attend the Annual Meeting without advance registration. Your 15-digit control number is provided on your proxy card, email, or Notice. Please follow the instructions on your proxy card, email, or Notice to attend the meeting. If you no longer have these documents, please contact Computershare at 1-888-332-2268.
Beneficial Shareholders. If you are a beneficial holder (i.e., you received your proxy materials from your broker, bank, or other agent), you may attend the meeting using either of the options described below.
Using the control number found on the voting instructions included with your proxy materials. On the day of the meeting, visit meetnow.global/ABT2025 and log in by entering the control number that appears on the voting instructions included with your proxy materials.
We expect that most beneficial shareholders will be able to attend the Annual Meeting, vote their shares, and ask questions using this option. However, Abbott recommends that you confirm this ability with the broker, bank, or other agent through which you hold your shares. If your broker, bank, or other agent does not provide for the ability to access the Annual Meeting using the control number included with your proxy materials, you must register in advance to attend the Annual Meeting as described below.
Registering in advance of the Annual Meeting. To register, you must submit your name, email address, and a legal proxy from your broker reflecting your ownership of Abbott shares.
Please send your registration materials to Computershare at legalproxy@computershare.com, with “Legal Proxy” in the subject line. Registration requests must be received by Computershare no later than 5 p.m. Eastern Time on Tuesday, April 22, 2025.
Requests for registration can also be submitted by mail to:
Computershare
Abbott Legal Proxy
P.O. Box 43001
Providence, RI 02940-3001
You will receive a confirmation of your registration by email from Computershare, along with a 15-digit control number needed to be admitted to the Annual Meeting.
| 84 | |
WHO CAN VOTE
Shareholders of record at the close of business on February 26, 2025 will be entitled to notice of and to vote at the Annual Meeting. As of January 31, 2025, Abbott had 1,734,323,411 outstanding common shares, which are Abbott’s only outstanding voting securities. All shareholders have cumulative voting rights in the election of directors and one vote per share on all other matters.
HOW TO VOTE
Whether or not you plan to virtually attend the Annual Meeting, Abbott strongly urges you to submit your proxy or vote your shares in advance of the Annual Meeting.
Registered shareholders. Registered shareholders may vote by mail by signing and promptly returning their proxy in the enclosed envelope. Abbott’s By-Laws provide that a shareholder may authorize no more than two persons as proxies to attend and vote at the meeting. Registered shareholders may also vote their shares:
| ● | by telephone (1-800-652-VOTE (8683)), or |
| ● | or on the Internet at www.investorvote.com/abt. |
If you vote by telephone or using the Internet, you do not need to return your proxy card. The instructions for voting can be found with your proxy card or on the Notice.
Beneficial shareholders. Beneficial shareholders should refer to the voting instructions provided by their broker, bank, or other agent to direct the voting of their shares in advance of the meeting.
Voting at the meeting. Shareholders participating in the Annual Meeting on the virtual meeting platform may vote their shares at the Annual Meeting.
HOW TO SUBMIT QUESTIONS
Following conclusion of the business items on the agenda for the Annual Meeting, Abbott will hold a live question and answer session where questions pertinent to meeting matters will be answered, as time permits. Shareholders participating in the meeting on the virtual meeting platform can submit questions during the Annual Meeting by clicking on the message icon in the upper right-hand corner of the page on the meeting center site. Questions that are substantially similar may be grouped together in a single response to avoid repetition and to allow more time for other questions.
TECHNICAL SUPPORT
The virtual meeting platform is fully supported across most internet browsers (MS Edge, Firefox, Chrome and Safari) and devices (desktops, laptops, tablets, and cell phones) running the most up to date version of applicable software and plugins. Participants should ensure that they have a strong WiFi connection wherever they intend to participate in the Annual Meeting. For further assistance, please call 1-888-724-2416 (toll free) or 1-781-575-2748 (international toll).
REVOKING A PROXY
You may revoke your proxy by voting at the Annual Meeting or, at any time prior to the meeting:
| ● | by delivering a written notice to the Secretary of Abbott, |
| ● | by delivering an authorized proxy with a later date, or |
| ● | by voting by telephone or using the Internet after you have given your proxy. |
|
85 |
CUMULATIVE VOTING
Cumulative voting allows a shareholder to multiply the number of shares owned by the number of directors to be elected and to cast the total for one nominee or distribute the votes among the nominees, as the shareholder desires. Shareholders may not cumulate their votes against a nominee. If you wish to cumulate your votes, you must sign and mail in your proxy card or attend the Annual Meeting.
DISCRETIONARY VOTING AUTHORITY
Unless authority is withheld in accordance with the instructions on the proxy, the persons named in the proxy will vote the shares covered by proxies they receive to elect the 12 nominees named in Item 1 on the proxy card. Should a nominee become unavailable to serve, the shares will be voted for a substitute designated by the Board of Directors, or for fewer than 12 nominees if, in the judgment of the proxy holders, such action is necessary or desirable. The persons named in the proxy may also decide to vote shares cumulatively in their sole discretion so that one or more of the nominees may receive fewer votes than the other nominees (or no votes at all), although they have no present intention of doing so. The proxy holders may not cast your vote for any nominee from whom you have withheld authority to vote.
Where a shareholder has specified a choice for or against the ratification of the appointment of Ernst & Young LLP as auditors, or the advisory vote on the approval of executive compensation, or where the shareholder has abstained on these matters, the shares represented by the proxy will be voted (or not voted) as specified. Where no choice has been specified, the proxy will be voted FOR the ratification of Ernst & Young LLP as auditors, and FOR the approval of executive compensation.
Aside from matters set forth in this proxy statement, the Board of Directors is not aware of any other issue which may properly be brought before the meeting. If other matters are properly brought before the meeting, the accompanying proxy will be voted in accordance with the judgment of the proxy holders.
QUORUM AND VOTE REQUIRED TO APPROVE EACH ITEM ON THE PROXY
A majority of the outstanding shares entitled to vote on a matter, represented at the meeting or by proxy, constitutes a quorum for consideration of that matter at the meeting. The affirmative vote of a majority of the shares represented at the meeting and entitled to vote on a matter shall be the act of the shareholders with respect to that matter.
EFFECT OF ABSTENTIONS AND BROKER NON-VOTES
Shares represented by proxies which are present and entitled to vote on a matter but which have elected to abstain from voting on another matter will have the effect of votes against those directors or that matter. A proxy submitted by an institution, such as a broker or bank that holds shares for the account of a beneficial owner, may indicate that all or a portion of the shares represented by that proxy are not being voted with respect to a particular matter. This could occur, for example, when the broker or bank is not permitted to vote those shares in the absence of instructions from the beneficial owner of the shares. These “non-voted shares” will be considered shares not present and, therefore, not entitled to vote on those matters, although these shares may be considered present and entitled to vote for other purposes. Brokers and banks have discretionary authority to vote shares in the absence of instructions on matters the New York Stock Exchange considers “routine”, such as the ratification of the appointment of the auditors. They do not have discretionary authority to vote shares in absence of instructions on “non-routine” matters. The election of directors, the advisory vote on the approval of executive compensation, and shareholder proposals are “non-routine” matters. Non-voted shares will not affect the determination of the outcome of the vote on any matter to be decided at the meeting.
| 86 | |
INSPECTORS OF ELECTION
The inspectors of election and the tabulators of all proxies, ballots, and voting tabulations that identify shareholders are independent and are not Abbott employees.
COST OF SOLICITING PROXIES
The accompanying proxy is solicited by the Board of Directors on behalf of Abbott for use at the Annual Meeting.
Abbott will bear the cost of making solicitations from its shareholders and will reimburse banks and brokerage firms for out-of-pocket expenses incurred in connection with this solicitation. Proxies may be solicited by mail, telephone, Internet, or in person by directors, officers, or employees of Abbott and its subsidiaries.
Abbott has retained Sodali & Co. to aid in the solicitation of proxies at an estimated cost of $21,500 plus reimbursement for reasonable out of pocket expenses.
ABBOTT LABORATORIES STOCK RETIREMENT PLAN
Participants in the Abbott Laboratories Stock Retirement Plan will receive voting instructions for their shares held in the Abbott Laboratories Stock Retirement Trust. The Stock Retirement Plan’s Investment Committee must solicit voting instructions from the participants and follow the voting instructions it receives. The Investment Committee may use its own discretion with respect to those shares for which no voting instructions are received.
CONFIDENTIAL VOTING
It is Abbott’s policy that all proxies, ballots, and voting tabulations that reveal how a particular shareholder has voted be kept confidential and not be disclosed, except:
| ● | where disclosure may be required by law or regulation, |
| ● | where disclosure may be necessary in order for Abbott to assert or defend claims, |
| ● | where a shareholder provides comments with a proxy, |
| ● | where a shareholder expressly requests disclosure, |
| ● | to allow the inspectors of election to certify the results of a vote, or |
| ● | in other limited circumstances, such as a contested election or proxy solicitation not approved and recommended by the Board of Directors. |
HOUSEHOLDING OF PROXY MATERIALS
Shareholders sharing an address may receive only one copy of the proxy materials or the Notice of Internet Availability of Proxy Materials, unless their broker, bank, or other intermediary has received contrary instructions from any shareholder at that address. This is known as “householding.” Shareholders wishing to discontinue householding and receive separate copies of the proxy materials or the Notice of Internet Availability of Proxy Materials should notify their broker, bank, or other intermediary.
|
87 |
CAUTIONARY STATEMENT REGARDING FORWARD-LOOKING STATEMENTS
This proxy statement contains statements that may be forward-looking statements for purposes of the Private Securities Litigation Reform Act of 1995. Words such as “expects,” “anticipates,” “intends,” “plans,” “believes,” “seeks,” “estimates,” “forecasts,” variations of these words, and similar expressions are intended to identify these forward-looking statements. Abbott cautions that these forward-looking statements are subject to risks and uncertainties that may cause actual results to differ materially from those indicated in the forward-looking statements, including but not limited to those risks and uncertainties identified under “Item 1A. Risk Factors” of Abbott’s Annual Report on Form 10-K for the year ended December 31, 2024. Abbott undertakes no obligation to release publicly any revisions to forward-looking statements as the result of subsequent events or developments, except as required by law.
The information on Abbott’s website, including the contents of Abbott’s Global Sustainability Report, Diversity and Inclusion Report, and 2030 Sustainability Plan, is not, and shall not be deemed to be, a part of this proxy statement or incorporated herein or into any of Abbott’s other filings with the Securities and Exchange Commission.
| 88 | |
INDUSTRY LEADERSHIP
| FORTUNE WORLD’S MOST ADMIRED COMPANIES since 1984 |
DOW JONES SUSTAINABILITY INDEX 20 years on the Index |
| TIME MAGAZINE BEST INVENTIONS OF 2024 Esprit BTK System |
FORTUNE AMERICA’S MOST INNOVATIVE COMPANIES No. 27 out of 200 |
| WALL STREET JOURNAL MANAGEMENT TOP 250 COMPANIES No. 41 overall and No. 10 for social responsibility in 2024 |
SCIENCE MAGAZINE TOP 20 EMPLOYERS for 21 years |
| AMERICA’S MOST JUST COMPANIES No. 1 in our industry and No. 36 overall on the JUST 100 list in 2024 |
SERAMOUNT 100 BEST COMPANIES for 24 years in a row and recognized us as a Top Company for Executive Women and Best Company for Multicultural Women |
| TOP 50 COMPANIES FOR FAIRNESS FAIR360, for 21 consecutive years |
CES 2025 INNOVATION AWARDS Abbott’s consumer biowearable, Lingo |
| FAST COMPANY NEXT BIG THINGS IN TECH Abbott’s consumer biowearable, Lingo |
EDISON AWARDS Alinity i TBI lab test (Gold) Aveir DR Leadless Pacemaker System (Silver) |
| VAULT BEST INTERNSHIPS No. 1 Health Sciences internship in 2025 |
REPTRAK MOST REPUTABLE COMPANIES Among 100 most reputable companies globally |
Abbott Laboratories
100 Abbott Park Road
Abbott Park, Illinois 60064-6400 U.S.A.
NOTICE OF ANNUAL MEETING
OF SHAREHOLDERS
AND PROXY STATEMENT
MEETING DATE
APRIL 25, 2025
9:00 A.M. CENTRAL TIME
| YOUR VOTE IS
IMPORTANT Please sign and promptly return your proxy in the enclosed envelope or vote your shares by telephone or using the Internet. |
|
The 2025 Annual Meeting of Shareholders will be held virtually at meetnow.global/ABT2025. Please see pages 84 and 85 of this proxy statement for instructions on how to attend the Annual Meeting. For technical support for the virtual meeting platform on the day of the Annual Meeting, please call 1-888-724-2416 (toll free) or 1-781-575-2748 (international toll). |
 |
 |
 |
|
 | |||
| Your
vote matters - here’s how to vote! You may vote online or by phone instead of mailing this card. | ||||
 |
Online Go to www.investorvote.com/abt or scan the QR code – login details are located in the shaded bar below. | |||
 |
Phone Call toll free 1-800-652-VOTE (8683) within the USA, US territories and Canada | |||
| Using a black ink pen, mark your votes with an X as shown in this example. Please do not write outside the designated areas. |  |
 |
Save paper, time and money! Sign up for electronic delivery at www.investorvote.com/abt | |
| 2025 Annual Meeting Proxy Card |  |
▼ IF VOTING BY MAIL, SIGN, DETACH AND RETURN THE BOTTOM PORTION IN THE ENCLOSED ENVELOPE. ▼
| A | Proposals – The Board of Directors recommends a vote FOR all the nominees listed in Item 1 and FOR Items 2 and 3. |
| 1. | Election of 12 Directors: |
| For | Against | Abstain | For | Against | Abstain | For | Against | Abstain |  | ||||||
| 01 - R. J. Alpern | o | o | o | 02 - C. Babineaux-Fontenot | o | o | o | 03 - S. E. Blount | o | o | o | ||||
| 04 - R. B. Ford | o | o | o | 05 - P. Gonzalez | o | o | o | 06 - M. A. Kumbier | o | o | o | ||||
| 07 - D. W. McDew | o | o | o | 08 - N. McKinstry | o | o | o | 09 - M. G. O’Grady | o | o | o | ||||
| 10 - M. F. Roman | o | o | o | 11 - D. J. Starks | o | o | o | 12 - J. G. Stratton | o | o | o | ||||
| For | Against | Abstain | ||||||||||
| 2. | Ratification of Ernst & Young LLP As Auditors | o | o | o | ||||||||
| 3. | Say on Pay - An Advisory Vote on the Approval of Executive Compensation | o | o | o |
| B | Authorized Signatures – This section must be completed for your vote to count. Please date and sign below. |
Please sign exactly as name(s) appears hereon. Joint owners should each sign. When signing as attorney, executor, administrator, corporate officer, trustee, guardian, or custodian, please give full title and, where more than one is named, a majority should sign.
| Date (mm/dd/yyyy) – Please print date below. | Signature 1 – Please keep signature within the box. | Signature 2 – Please keep signature within the box. | ||
| / / |
 |
 |
|
0430GB
The 2025 Annual Meeting of Shareholders will be held virtually at meetnow.global/ABT2025.
Please see the accompanying Proxy Statement for instructions on how to attend the meeting.
 |
Small steps make an impact.
Help the environment by consenting to receive electronic |
 |
▼ IF VOTING BY MAIL, SIGN, DETACH AND RETURN THE BOTTOM PORTION IN THE ENCLOSED ENVELOPE. ▼
| Proxy – Abbott Laboratories | |
Proxy Solicited on Behalf of the Board of Directors for Annual Meeting - April 25, 2025
The undersigned, revoking all previous proxies, acknowledges receipt of the Notice and Proxy Statement dated March 14, 2025, in connection with the Annual Meeting of Shareholders of Abbott Laboratories to be held at 9:00 a.m. Central Time on Friday, April 25, 2025, and hereby appoints Robert B. Ford and Hubert L. Allen, or either of them, proxy for the undersigned, with full power of substitution, to represent and vote all shares of the undersigned upon all matters properly coming before the Annual Meeting or any adjournments thereof.
If the undersigned is a participant in the Abbott Laboratories Stock Retirement Plan, then this card also instructs the plan’s Investment Committee to vote as specified at the 2025 Annual Meeting of Shareholders, and any adjournments thereof, all shares of Abbott Laboratories held in the undersigned’s plan account upon the matters indicated and in their discretion upon such other matters as may properly come before the meeting.
Abbott’s proxy holders reserve the right to vote shares cumulatively in their sole discretion so that one or more of the nominees may receive fewer votes than other nominees (or no votes at all).
This proxy when properly executed will be voted in the manner directed herein by the undersigned shareholder. If no such directions are indicated, this proxy will be voted FOR the election of the nominees listed in Item 1 and FOR Items 2 and 3. In their discretion, the proxy holders are authorized to vote upon any other matters as may properly come before the meeting.
(Items to be voted appear on reverse side)
| C | Non-Voting Items |
| Change of Address – Please print new address below. | Comments – Please print your comments below. | |
|
|
Cover |
12 Months Ended |
|---|---|
Dec. 31, 2024 | |
| Cover [Abstract] | |
| Document Type | DEF 14A |
| Entity Registrant Name | Abbott Laboratories |
| Entity Central Index Key | 0000001800 |
| Amendment Flag | false |
Pay vs Performance Disclosure - USD ($) |
3 Months Ended | 9 Months Ended | 12 Months Ended | 24 Months Ended | 36 Months Ended | 48 Months Ended | 60 Months Ended | ||||||||||||||||||||||||||||||||||||||||||||||||||||||||||||||||||||||||||||||||||||||||||||||||||||||||||||||||||||||||||||||||||||||||||||||||||||||||||||||||||||||||||||||||||||||||||||||||||||||||||||||||||||||||||||||||||||||||||||||||||||||||||||||||||||||||||||||||||||||||||||||||||||||||||||||||||||||||||||||||||||||||||||||||||||||||||||||||||||||||||||||||||||||
|---|---|---|---|---|---|---|---|---|---|---|---|---|---|---|---|---|---|---|---|---|---|---|---|---|---|---|---|---|---|---|---|---|---|---|---|---|---|---|---|---|---|---|---|---|---|---|---|---|---|---|---|---|---|---|---|---|---|---|---|---|---|---|---|---|---|---|---|---|---|---|---|---|---|---|---|---|---|---|---|---|---|---|---|---|---|---|---|---|---|---|---|---|---|---|---|---|---|---|---|---|---|---|---|---|---|---|---|---|---|---|---|---|---|---|---|---|---|---|---|---|---|---|---|---|---|---|---|---|---|---|---|---|---|---|---|---|---|---|---|---|---|---|---|---|---|---|---|---|---|---|---|---|---|---|---|---|---|---|---|---|---|---|---|---|---|---|---|---|---|---|---|---|---|---|---|---|---|---|---|---|---|---|---|---|---|---|---|---|---|---|---|---|---|---|---|---|---|---|---|---|---|---|---|---|---|---|---|---|---|---|---|---|---|---|---|---|---|---|---|---|---|---|---|---|---|---|---|---|---|---|---|---|---|---|---|---|---|---|---|---|---|---|---|---|---|---|---|---|---|---|---|---|---|---|---|---|---|---|---|---|---|---|---|---|---|---|---|---|---|---|---|---|---|---|---|---|---|---|---|---|---|---|---|---|---|---|---|---|---|---|---|---|---|---|---|---|---|---|---|---|---|---|---|---|---|---|---|---|---|---|---|---|---|---|---|---|---|---|---|---|---|---|---|---|---|---|---|---|---|---|---|---|---|---|---|---|---|---|---|---|---|---|---|---|---|---|---|---|---|---|---|---|---|---|---|---|---|---|---|---|---|---|---|---|---|---|---|---|---|---|---|---|---|---|---|---|---|---|---|---|---|
Mar. 30, 2020 |
Dec. 31, 2020 |
Dec. 31, 2024 |
Dec. 31, 2023 |
Dec. 31, 2022 |
Dec. 31, 2021 |
Dec. 31, 2020 |
Dec. 31, 2021 |
Dec. 31, 2022 |
Dec. 31, 2023 |
Dec. 31, 2024 |
|||||||||||||||||||||||||||||||||||||||||||||||||||||||||||||||||||||||||||||||||||||||||||||||||||||||||||||||||||||||||||||||||||||||||||||||||||||||||||||||||||||||||||||||||||||||||||||||||||||||||||||||||||||||||||||||||||||||||||||||||||||||||||||||||||||||||||||||||||||||||||||||||||||||||||||||||||||||||||||||||||||||||||||||||||||||||||||||||||||||||||||||||||
| Pay vs Performance Disclosure [Table] | |||||||||||||||||||||||||||||||||||||||||||||||||||||||||||||||||||||||||||||||||||||||||||||||||||||||||||||||||||||||||||||||||||||||||||||||||||||||||||||||||||||||||||||||||||||||||||||||||||||||||||||||||||||||||||||||||||||||||||||||||||||||||||||||||||||||||||||||||||||||||||||||||||||||||||||||||||||||||||||||||||||||||||||||||||||||||||||||||||||||||||||||||||||||||||||
| Pay vs Performance Disclosure, Table |
The following table presents the Company’s pay versus performance disclosure as required by the SEC. The “Compensation Actually Paid” portions of this table are calculated in accordance with SEC rules and include certain amounts that were not received during the respective fiscal year and may not be received in the future. The section of the proxy statement captioned, “Compensation Discussion and Analysis—Basis for Compensation Decisions” describes how the Compensation Committee links pay to performance.
|
||||||||||||||||||||||||||||||||||||||||||||||||||||||||||||||||||||||||||||||||||||||||||||||||||||||||||||||||||||||||||||||||||||||||||||||||||||||||||||||||||||||||||||||||||||||||||||||||||||||||||||||||||||||||||||||||||||||||||||||||||||||||||||||||||||||||||||||||||||||||||||||||||||||||||||||||||||||||||||||||||||||||||||||||||||||||||||||||||||||||||||||||||||||||||||
| Company Selected Measure Name | Adjusted Diluted EPS | ||||||||||||||||||||||||||||||||||||||||||||||||||||||||||||||||||||||||||||||||||||||||||||||||||||||||||||||||||||||||||||||||||||||||||||||||||||||||||||||||||||||||||||||||||||||||||||||||||||||||||||||||||||||||||||||||||||||||||||||||||||||||||||||||||||||||||||||||||||||||||||||||||||||||||||||||||||||||||||||||||||||||||||||||||||||||||||||||||||||||||||||||||||||||||||
| Named Executive Officers, Footnote |
|
||||||||||||||||||||||||||||||||||||||||||||||||||||||||||||||||||||||||||||||||||||||||||||||||||||||||||||||||||||||||||||||||||||||||||||||||||||||||||||||||||||||||||||||||||||||||||||||||||||||||||||||||||||||||||||||||||||||||||||||||||||||||||||||||||||||||||||||||||||||||||||||||||||||||||||||||||||||||||||||||||||||||||||||||||||||||||||||||||||||||||||||||||||||||||||
| Peer Group Issuers, Footnote [Text Block] |
|
||||||||||||||||||||||||||||||||||||||||||||||||||||||||||||||||||||||||||||||||||||||||||||||||||||||||||||||||||||||||||||||||||||||||||||||||||||||||||||||||||||||||||||||||||||||||||||||||||||||||||||||||||||||||||||||||||||||||||||||||||||||||||||||||||||||||||||||||||||||||||||||||||||||||||||||||||||||||||||||||||||||||||||||||||||||||||||||||||||||||||||||||||||||||||||
| Adjustment To PEO Compensation, Footnote |
|
||||||||||||||||||||||||||||||||||||||||||||||||||||||||||||||||||||||||||||||||||||||||||||||||||||||||||||||||||||||||||||||||||||||||||||||||||||||||||||||||||||||||||||||||||||||||||||||||||||||||||||||||||||||||||||||||||||||||||||||||||||||||||||||||||||||||||||||||||||||||||||||||||||||||||||||||||||||||||||||||||||||||||||||||||||||||||||||||||||||||||||||||||||||||||||
| Non-PEO NEO Average Total Compensation Amount | $ 7,362,647 | $ 6,232,663 | $ 7,402,414 | $ 9,267,772 | $ 6,902,127 | ||||||||||||||||||||||||||||||||||||||||||||||||||||||||||||||||||||||||||||||||||||||||||||||||||||||||||||||||||||||||||||||||||||||||||||||||||||||||||||||||||||||||||||||||||||||||||||||||||||||||||||||||||||||||||||||||||||||||||||||||||||||||||||||||||||||||||||||||||||||||||||||||||||||||||||||||||||||||||||||||||||||||||||||||||||||||||||||||||||||||||||||||||||||||
| Non-PEO NEO Average Compensation Actually Paid Amount | $ 7,713,265 | 5,691,925 | 2,903,667 | 20,389,311 | 10,929,581 | ||||||||||||||||||||||||||||||||||||||||||||||||||||||||||||||||||||||||||||||||||||||||||||||||||||||||||||||||||||||||||||||||||||||||||||||||||||||||||||||||||||||||||||||||||||||||||||||||||||||||||||||||||||||||||||||||||||||||||||||||||||||||||||||||||||||||||||||||||||||||||||||||||||||||||||||||||||||||||||||||||||||||||||||||||||||||||||||||||||||||||||||||||||||||
| Adjustment to Non-PEO NEO Compensation Footnote [Text Block] |
|
||||||||||||||||||||||||||||||||||||||||||||||||||||||||||||||||||||||||||||||||||||||||||||||||||||||||||||||||||||||||||||||||||||||||||||||||||||||||||||||||||||||||||||||||||||||||||||||||||||||||||||||||||||||||||||||||||||||||||||||||||||||||||||||||||||||||||||||||||||||||||||||||||||||||||||||||||||||||||||||||||||||||||||||||||||||||||||||||||||||||||||||||||||||||||||
| Compensation Actually Paid vs. Total Shareholder Return [Text Block] |
|
||||||||||||||||||||||||||||||||||||||||||||||||||||||||||||||||||||||||||||||||||||||||||||||||||||||||||||||||||||||||||||||||||||||||||||||||||||||||||||||||||||||||||||||||||||||||||||||||||||||||||||||||||||||||||||||||||||||||||||||||||||||||||||||||||||||||||||||||||||||||||||||||||||||||||||||||||||||||||||||||||||||||||||||||||||||||||||||||||||||||||||||||||||||||||||
| Compensation Actually Paid vs. Net Income [Text Block] |
|
||||||||||||||||||||||||||||||||||||||||||||||||||||||||||||||||||||||||||||||||||||||||||||||||||||||||||||||||||||||||||||||||||||||||||||||||||||||||||||||||||||||||||||||||||||||||||||||||||||||||||||||||||||||||||||||||||||||||||||||||||||||||||||||||||||||||||||||||||||||||||||||||||||||||||||||||||||||||||||||||||||||||||||||||||||||||||||||||||||||||||||||||||||||||||||
| Compensation Actually Paid vs. Company Selected Measure [Text Block] |
|
||||||||||||||||||||||||||||||||||||||||||||||||||||||||||||||||||||||||||||||||||||||||||||||||||||||||||||||||||||||||||||||||||||||||||||||||||||||||||||||||||||||||||||||||||||||||||||||||||||||||||||||||||||||||||||||||||||||||||||||||||||||||||||||||||||||||||||||||||||||||||||||||||||||||||||||||||||||||||||||||||||||||||||||||||||||||||||||||||||||||||||||||||||||||||||
| Total Shareholder Return Vs Peer Group [Text Block] |
|
||||||||||||||||||||||||||||||||||||||||||||||||||||||||||||||||||||||||||||||||||||||||||||||||||||||||||||||||||||||||||||||||||||||||||||||||||||||||||||||||||||||||||||||||||||||||||||||||||||||||||||||||||||||||||||||||||||||||||||||||||||||||||||||||||||||||||||||||||||||||||||||||||||||||||||||||||||||||||||||||||||||||||||||||||||||||||||||||||||||||||||||||||||||||||||
| Tabular List [Table Text Block] |
The following list includes the most important performance measures used to link the compensation of our named officers for the most recently completed fiscal year to Company performance and business strategy. Please see page 34 of the CD&A for additional detail.
|
||||||||||||||||||||||||||||||||||||||||||||||||||||||||||||||||||||||||||||||||||||||||||||||||||||||||||||||||||||||||||||||||||||||||||||||||||||||||||||||||||||||||||||||||||||||||||||||||||||||||||||||||||||||||||||||||||||||||||||||||||||||||||||||||||||||||||||||||||||||||||||||||||||||||||||||||||||||||||||||||||||||||||||||||||||||||||||||||||||||||||||||||||||||||||||
| Total Shareholder Return Amount | 128 | $ 167 | $ 133 | $ 136 | $ 142 | ||||||||||||||||||||||||||||||||||||||||||||||||||||||||||||||||||||||||||||||||||||||||||||||||||||||||||||||||||||||||||||||||||||||||||||||||||||||||||||||||||||||||||||||||||||||||||||||||||||||||||||||||||||||||||||||||||||||||||||||||||||||||||||||||||||||||||||||||||||||||||||||||||||||||||||||||||||||||||||||||||||||||||||||||||||||||||||||||||||||||||||||||||||||||
| Peer Group Total Shareholder Return Amount | 113 | $ 143 | $ 140 | $ 143 | $ 147 | ||||||||||||||||||||||||||||||||||||||||||||||||||||||||||||||||||||||||||||||||||||||||||||||||||||||||||||||||||||||||||||||||||||||||||||||||||||||||||||||||||||||||||||||||||||||||||||||||||||||||||||||||||||||||||||||||||||||||||||||||||||||||||||||||||||||||||||||||||||||||||||||||||||||||||||||||||||||||||||||||||||||||||||||||||||||||||||||||||||||||||||||||||||||||
| Net Income (Loss) Attributable to Parent | $ 8,133,000,000 | $ 5,723,000,000 | $ 6,933,000,000 | $ 7,071,000,000 | $ 4,495,000,000 | ||||||||||||||||||||||||||||||||||||||||||||||||||||||||||||||||||||||||||||||||||||||||||||||||||||||||||||||||||||||||||||||||||||||||||||||||||||||||||||||||||||||||||||||||||||||||||||||||||||||||||||||||||||||||||||||||||||||||||||||||||||||||||||||||||||||||||||||||||||||||||||||||||||||||||||||||||||||||||||||||||||||||||||||||||||||||||||||||||||||||||||||||||||||||
| Company Selected Measure Amount | 4.67 | 4.44 | 5.34 | 5.21 | 3.65 | ||||||||||||||||||||||||||||||||||||||||||||||||||||||||||||||||||||||||||||||||||||||||||||||||||||||||||||||||||||||||||||||||||||||||||||||||||||||||||||||||||||||||||||||||||||||||||||||||||||||||||||||||||||||||||||||||||||||||||||||||||||||||||||||||||||||||||||||||||||||||||||||||||||||||||||||||||||||||||||||||||||||||||||||||||||||||||||||||||||||||||||||||||||||||
| PEO Name | White | Ford’s | Ford | Ford | Ford | Ford | |||||||||||||||||||||||||||||||||||||||||||||||||||||||||||||||||||||||||||||||||||||||||||||||||||||||||||||||||||||||||||||||||||||||||||||||||||||||||||||||||||||||||||||||||||||||||||||||||||||||||||||||||||||||||||||||||||||||||||||||||||||||||||||||||||||||||||||||||||||||||||||||||||||||||||||||||||||||||||||||||||||||||||||||||||||||||||||||||||||||||||||||||||||||
| Measure [Axis]: 1 | |||||||||||||||||||||||||||||||||||||||||||||||||||||||||||||||||||||||||||||||||||||||||||||||||||||||||||||||||||||||||||||||||||||||||||||||||||||||||||||||||||||||||||||||||||||||||||||||||||||||||||||||||||||||||||||||||||||||||||||||||||||||||||||||||||||||||||||||||||||||||||||||||||||||||||||||||||||||||||||||||||||||||||||||||||||||||||||||||||||||||||||||||||||||||||||
| Pay vs Performance Disclosure [Table] | |||||||||||||||||||||||||||||||||||||||||||||||||||||||||||||||||||||||||||||||||||||||||||||||||||||||||||||||||||||||||||||||||||||||||||||||||||||||||||||||||||||||||||||||||||||||||||||||||||||||||||||||||||||||||||||||||||||||||||||||||||||||||||||||||||||||||||||||||||||||||||||||||||||||||||||||||||||||||||||||||||||||||||||||||||||||||||||||||||||||||||||||||||||||||||||
| Measure Name | Diluted EPS | ||||||||||||||||||||||||||||||||||||||||||||||||||||||||||||||||||||||||||||||||||||||||||||||||||||||||||||||||||||||||||||||||||||||||||||||||||||||||||||||||||||||||||||||||||||||||||||||||||||||||||||||||||||||||||||||||||||||||||||||||||||||||||||||||||||||||||||||||||||||||||||||||||||||||||||||||||||||||||||||||||||||||||||||||||||||||||||||||||||||||||||||||||||||||||||
| Non-GAAP Measure Description [Text Block] |
|
||||||||||||||||||||||||||||||||||||||||||||||||||||||||||||||||||||||||||||||||||||||||||||||||||||||||||||||||||||||||||||||||||||||||||||||||||||||||||||||||||||||||||||||||||||||||||||||||||||||||||||||||||||||||||||||||||||||||||||||||||||||||||||||||||||||||||||||||||||||||||||||||||||||||||||||||||||||||||||||||||||||||||||||||||||||||||||||||||||||||||||||||||||||||||||
| Measure [Axis]: 2 | |||||||||||||||||||||||||||||||||||||||||||||||||||||||||||||||||||||||||||||||||||||||||||||||||||||||||||||||||||||||||||||||||||||||||||||||||||||||||||||||||||||||||||||||||||||||||||||||||||||||||||||||||||||||||||||||||||||||||||||||||||||||||||||||||||||||||||||||||||||||||||||||||||||||||||||||||||||||||||||||||||||||||||||||||||||||||||||||||||||||||||||||||||||||||||||
| Pay vs Performance Disclosure [Table] | |||||||||||||||||||||||||||||||||||||||||||||||||||||||||||||||||||||||||||||||||||||||||||||||||||||||||||||||||||||||||||||||||||||||||||||||||||||||||||||||||||||||||||||||||||||||||||||||||||||||||||||||||||||||||||||||||||||||||||||||||||||||||||||||||||||||||||||||||||||||||||||||||||||||||||||||||||||||||||||||||||||||||||||||||||||||||||||||||||||||||||||||||||||||||||||
| Measure Name | Sales | ||||||||||||||||||||||||||||||||||||||||||||||||||||||||||||||||||||||||||||||||||||||||||||||||||||||||||||||||||||||||||||||||||||||||||||||||||||||||||||||||||||||||||||||||||||||||||||||||||||||||||||||||||||||||||||||||||||||||||||||||||||||||||||||||||||||||||||||||||||||||||||||||||||||||||||||||||||||||||||||||||||||||||||||||||||||||||||||||||||||||||||||||||||||||||||
| Measure [Axis]: 3 | |||||||||||||||||||||||||||||||||||||||||||||||||||||||||||||||||||||||||||||||||||||||||||||||||||||||||||||||||||||||||||||||||||||||||||||||||||||||||||||||||||||||||||||||||||||||||||||||||||||||||||||||||||||||||||||||||||||||||||||||||||||||||||||||||||||||||||||||||||||||||||||||||||||||||||||||||||||||||||||||||||||||||||||||||||||||||||||||||||||||||||||||||||||||||||||
| Pay vs Performance Disclosure [Table] | |||||||||||||||||||||||||||||||||||||||||||||||||||||||||||||||||||||||||||||||||||||||||||||||||||||||||||||||||||||||||||||||||||||||||||||||||||||||||||||||||||||||||||||||||||||||||||||||||||||||||||||||||||||||||||||||||||||||||||||||||||||||||||||||||||||||||||||||||||||||||||||||||||||||||||||||||||||||||||||||||||||||||||||||||||||||||||||||||||||||||||||||||||||||||||||
| Measure Name | Return on Assets | ||||||||||||||||||||||||||||||||||||||||||||||||||||||||||||||||||||||||||||||||||||||||||||||||||||||||||||||||||||||||||||||||||||||||||||||||||||||||||||||||||||||||||||||||||||||||||||||||||||||||||||||||||||||||||||||||||||||||||||||||||||||||||||||||||||||||||||||||||||||||||||||||||||||||||||||||||||||||||||||||||||||||||||||||||||||||||||||||||||||||||||||||||||||||||||
| Measure [Axis]: 4 | |||||||||||||||||||||||||||||||||||||||||||||||||||||||||||||||||||||||||||||||||||||||||||||||||||||||||||||||||||||||||||||||||||||||||||||||||||||||||||||||||||||||||||||||||||||||||||||||||||||||||||||||||||||||||||||||||||||||||||||||||||||||||||||||||||||||||||||||||||||||||||||||||||||||||||||||||||||||||||||||||||||||||||||||||||||||||||||||||||||||||||||||||||||||||||||
| Pay vs Performance Disclosure [Table] | |||||||||||||||||||||||||||||||||||||||||||||||||||||||||||||||||||||||||||||||||||||||||||||||||||||||||||||||||||||||||||||||||||||||||||||||||||||||||||||||||||||||||||||||||||||||||||||||||||||||||||||||||||||||||||||||||||||||||||||||||||||||||||||||||||||||||||||||||||||||||||||||||||||||||||||||||||||||||||||||||||||||||||||||||||||||||||||||||||||||||||||||||||||||||||||
| Measure Name | Free Cash Flow | ||||||||||||||||||||||||||||||||||||||||||||||||||||||||||||||||||||||||||||||||||||||||||||||||||||||||||||||||||||||||||||||||||||||||||||||||||||||||||||||||||||||||||||||||||||||||||||||||||||||||||||||||||||||||||||||||||||||||||||||||||||||||||||||||||||||||||||||||||||||||||||||||||||||||||||||||||||||||||||||||||||||||||||||||||||||||||||||||||||||||||||||||||||||||||||
| Measure [Axis]: 5 | |||||||||||||||||||||||||||||||||||||||||||||||||||||||||||||||||||||||||||||||||||||||||||||||||||||||||||||||||||||||||||||||||||||||||||||||||||||||||||||||||||||||||||||||||||||||||||||||||||||||||||||||||||||||||||||||||||||||||||||||||||||||||||||||||||||||||||||||||||||||||||||||||||||||||||||||||||||||||||||||||||||||||||||||||||||||||||||||||||||||||||||||||||||||||||||
| Pay vs Performance Disclosure [Table] | |||||||||||||||||||||||||||||||||||||||||||||||||||||||||||||||||||||||||||||||||||||||||||||||||||||||||||||||||||||||||||||||||||||||||||||||||||||||||||||||||||||||||||||||||||||||||||||||||||||||||||||||||||||||||||||||||||||||||||||||||||||||||||||||||||||||||||||||||||||||||||||||||||||||||||||||||||||||||||||||||||||||||||||||||||||||||||||||||||||||||||||||||||||||||||||
| Measure Name | Gross Margin | ||||||||||||||||||||||||||||||||||||||||||||||||||||||||||||||||||||||||||||||||||||||||||||||||||||||||||||||||||||||||||||||||||||||||||||||||||||||||||||||||||||||||||||||||||||||||||||||||||||||||||||||||||||||||||||||||||||||||||||||||||||||||||||||||||||||||||||||||||||||||||||||||||||||||||||||||||||||||||||||||||||||||||||||||||||||||||||||||||||||||||||||||||||||||||||
| Measure [Axis]: 6 | |||||||||||||||||||||||||||||||||||||||||||||||||||||||||||||||||||||||||||||||||||||||||||||||||||||||||||||||||||||||||||||||||||||||||||||||||||||||||||||||||||||||||||||||||||||||||||||||||||||||||||||||||||||||||||||||||||||||||||||||||||||||||||||||||||||||||||||||||||||||||||||||||||||||||||||||||||||||||||||||||||||||||||||||||||||||||||||||||||||||||||||||||||||||||||||
| Pay vs Performance Disclosure [Table] | |||||||||||||||||||||||||||||||||||||||||||||||||||||||||||||||||||||||||||||||||||||||||||||||||||||||||||||||||||||||||||||||||||||||||||||||||||||||||||||||||||||||||||||||||||||||||||||||||||||||||||||||||||||||||||||||||||||||||||||||||||||||||||||||||||||||||||||||||||||||||||||||||||||||||||||||||||||||||||||||||||||||||||||||||||||||||||||||||||||||||||||||||||||||||||||
| Measure Name | Total Shareholder Return | ||||||||||||||||||||||||||||||||||||||||||||||||||||||||||||||||||||||||||||||||||||||||||||||||||||||||||||||||||||||||||||||||||||||||||||||||||||||||||||||||||||||||||||||||||||||||||||||||||||||||||||||||||||||||||||||||||||||||||||||||||||||||||||||||||||||||||||||||||||||||||||||||||||||||||||||||||||||||||||||||||||||||||||||||||||||||||||||||||||||||||||||||||||||||||||
| Measure [Axis]: 7 | |||||||||||||||||||||||||||||||||||||||||||||||||||||||||||||||||||||||||||||||||||||||||||||||||||||||||||||||||||||||||||||||||||||||||||||||||||||||||||||||||||||||||||||||||||||||||||||||||||||||||||||||||||||||||||||||||||||||||||||||||||||||||||||||||||||||||||||||||||||||||||||||||||||||||||||||||||||||||||||||||||||||||||||||||||||||||||||||||||||||||||||||||||||||||||||
| Pay vs Performance Disclosure [Table] | |||||||||||||||||||||||||||||||||||||||||||||||||||||||||||||||||||||||||||||||||||||||||||||||||||||||||||||||||||||||||||||||||||||||||||||||||||||||||||||||||||||||||||||||||||||||||||||||||||||||||||||||||||||||||||||||||||||||||||||||||||||||||||||||||||||||||||||||||||||||||||||||||||||||||||||||||||||||||||||||||||||||||||||||||||||||||||||||||||||||||||||||||||||||||||||
| Measure Name | Return on Equity | ||||||||||||||||||||||||||||||||||||||||||||||||||||||||||||||||||||||||||||||||||||||||||||||||||||||||||||||||||||||||||||||||||||||||||||||||||||||||||||||||||||||||||||||||||||||||||||||||||||||||||||||||||||||||||||||||||||||||||||||||||||||||||||||||||||||||||||||||||||||||||||||||||||||||||||||||||||||||||||||||||||||||||||||||||||||||||||||||||||||||||||||||||||||||||||
| Measure [Axis]: 8 | |||||||||||||||||||||||||||||||||||||||||||||||||||||||||||||||||||||||||||||||||||||||||||||||||||||||||||||||||||||||||||||||||||||||||||||||||||||||||||||||||||||||||||||||||||||||||||||||||||||||||||||||||||||||||||||||||||||||||||||||||||||||||||||||||||||||||||||||||||||||||||||||||||||||||||||||||||||||||||||||||||||||||||||||||||||||||||||||||||||||||||||||||||||||||||||
| Pay vs Performance Disclosure [Table] | |||||||||||||||||||||||||||||||||||||||||||||||||||||||||||||||||||||||||||||||||||||||||||||||||||||||||||||||||||||||||||||||||||||||||||||||||||||||||||||||||||||||||||||||||||||||||||||||||||||||||||||||||||||||||||||||||||||||||||||||||||||||||||||||||||||||||||||||||||||||||||||||||||||||||||||||||||||||||||||||||||||||||||||||||||||||||||||||||||||||||||||||||||||||||||||
| Measure Name | Division Margin | ||||||||||||||||||||||||||||||||||||||||||||||||||||||||||||||||||||||||||||||||||||||||||||||||||||||||||||||||||||||||||||||||||||||||||||||||||||||||||||||||||||||||||||||||||||||||||||||||||||||||||||||||||||||||||||||||||||||||||||||||||||||||||||||||||||||||||||||||||||||||||||||||||||||||||||||||||||||||||||||||||||||||||||||||||||||||||||||||||||||||||||||||||||||||||||
| Change In Accumulated Benefits Under Defined Benefit And Actuarial Pension Plans [Member] | Non-PEO NEO [Member] | |||||||||||||||||||||||||||||||||||||||||||||||||||||||||||||||||||||||||||||||||||||||||||||||||||||||||||||||||||||||||||||||||||||||||||||||||||||||||||||||||||||||||||||||||||||||||||||||||||||||||||||||||||||||||||||||||||||||||||||||||||||||||||||||||||||||||||||||||||||||||||||||||||||||||||||||||||||||||||||||||||||||||||||||||||||||||||||||||||||||||||||||||||||||||||||
| Pay vs Performance Disclosure [Table] | |||||||||||||||||||||||||||||||||||||||||||||||||||||||||||||||||||||||||||||||||||||||||||||||||||||||||||||||||||||||||||||||||||||||||||||||||||||||||||||||||||||||||||||||||||||||||||||||||||||||||||||||||||||||||||||||||||||||||||||||||||||||||||||||||||||||||||||||||||||||||||||||||||||||||||||||||||||||||||||||||||||||||||||||||||||||||||||||||||||||||||||||||||||||||||||
| Adjustment to Compensation Amount | $ (239,056) | $ (618,518) | $ 0 | $ (503,651) | $ (1,590,997) | ||||||||||||||||||||||||||||||||||||||||||||||||||||||||||||||||||||||||||||||||||||||||||||||||||||||||||||||||||||||||||||||||||||||||||||||||||||||||||||||||||||||||||||||||||||||||||||||||||||||||||||||||||||||||||||||||||||||||||||||||||||||||||||||||||||||||||||||||||||||||||||||||||||||||||||||||||||||||||||||||||||||||||||||||||||||||||||||||||||||||||||||||||||||||
| Service Costs Under Defined Benefit And Actuarial Pension Plans [Member] | Non-PEO NEO [Member] | |||||||||||||||||||||||||||||||||||||||||||||||||||||||||||||||||||||||||||||||||||||||||||||||||||||||||||||||||||||||||||||||||||||||||||||||||||||||||||||||||||||||||||||||||||||||||||||||||||||||||||||||||||||||||||||||||||||||||||||||||||||||||||||||||||||||||||||||||||||||||||||||||||||||||||||||||||||||||||||||||||||||||||||||||||||||||||||||||||||||||||||||||||||||||||||
| Pay vs Performance Disclosure [Table] | |||||||||||||||||||||||||||||||||||||||||||||||||||||||||||||||||||||||||||||||||||||||||||||||||||||||||||||||||||||||||||||||||||||||||||||||||||||||||||||||||||||||||||||||||||||||||||||||||||||||||||||||||||||||||||||||||||||||||||||||||||||||||||||||||||||||||||||||||||||||||||||||||||||||||||||||||||||||||||||||||||||||||||||||||||||||||||||||||||||||||||||||||||||||||||||
| Adjustment to Compensation Amount | 191,517 | 168,628 | 290,245 | 263,706 | 214,361 | ||||||||||||||||||||||||||||||||||||||||||||||||||||||||||||||||||||||||||||||||||||||||||||||||||||||||||||||||||||||||||||||||||||||||||||||||||||||||||||||||||||||||||||||||||||||||||||||||||||||||||||||||||||||||||||||||||||||||||||||||||||||||||||||||||||||||||||||||||||||||||||||||||||||||||||||||||||||||||||||||||||||||||||||||||||||||||||||||||||||||||||||||||||||||
| Grant Date Fair Value Of Option Awards And Stock Awards Granted In Fiscal Year [Member] | Non-PEO NEO [Member] | |||||||||||||||||||||||||||||||||||||||||||||||||||||||||||||||||||||||||||||||||||||||||||||||||||||||||||||||||||||||||||||||||||||||||||||||||||||||||||||||||||||||||||||||||||||||||||||||||||||||||||||||||||||||||||||||||||||||||||||||||||||||||||||||||||||||||||||||||||||||||||||||||||||||||||||||||||||||||||||||||||||||||||||||||||||||||||||||||||||||||||||||||||||||||||||
| Pay vs Performance Disclosure [Table] | |||||||||||||||||||||||||||||||||||||||||||||||||||||||||||||||||||||||||||||||||||||||||||||||||||||||||||||||||||||||||||||||||||||||||||||||||||||||||||||||||||||||||||||||||||||||||||||||||||||||||||||||||||||||||||||||||||||||||||||||||||||||||||||||||||||||||||||||||||||||||||||||||||||||||||||||||||||||||||||||||||||||||||||||||||||||||||||||||||||||||||||||||||||||||||||
| Adjustment to Compensation Amount | (4,602,725) | (3,561,910) | (5,406,145) | (6,156,884) | (3,551,089) | ||||||||||||||||||||||||||||||||||||||||||||||||||||||||||||||||||||||||||||||||||||||||||||||||||||||||||||||||||||||||||||||||||||||||||||||||||||||||||||||||||||||||||||||||||||||||||||||||||||||||||||||||||||||||||||||||||||||||||||||||||||||||||||||||||||||||||||||||||||||||||||||||||||||||||||||||||||||||||||||||||||||||||||||||||||||||||||||||||||||||||||||||||||||||
| Fair Value At Fiscal Year Endof Outstanding And Unvested Option Awards And Stock Awards Granted In Fiscal Year [Member] | Non-PEO NEO [Member] | |||||||||||||||||||||||||||||||||||||||||||||||||||||||||||||||||||||||||||||||||||||||||||||||||||||||||||||||||||||||||||||||||||||||||||||||||||||||||||||||||||||||||||||||||||||||||||||||||||||||||||||||||||||||||||||||||||||||||||||||||||||||||||||||||||||||||||||||||||||||||||||||||||||||||||||||||||||||||||||||||||||||||||||||||||||||||||||||||||||||||||||||||||||||||||||
| Pay vs Performance Disclosure [Table] | |||||||||||||||||||||||||||||||||||||||||||||||||||||||||||||||||||||||||||||||||||||||||||||||||||||||||||||||||||||||||||||||||||||||||||||||||||||||||||||||||||||||||||||||||||||||||||||||||||||||||||||||||||||||||||||||||||||||||||||||||||||||||||||||||||||||||||||||||||||||||||||||||||||||||||||||||||||||||||||||||||||||||||||||||||||||||||||||||||||||||||||||||||||||||||||
| Adjustment to Compensation Amount | 4,331,148 | 3,820,883 | 5,274,761 | 8,052,203 | 5,868,700 | ||||||||||||||||||||||||||||||||||||||||||||||||||||||||||||||||||||||||||||||||||||||||||||||||||||||||||||||||||||||||||||||||||||||||||||||||||||||||||||||||||||||||||||||||||||||||||||||||||||||||||||||||||||||||||||||||||||||||||||||||||||||||||||||||||||||||||||||||||||||||||||||||||||||||||||||||||||||||||||||||||||||||||||||||||||||||||||||||||||||||||||||||||||||||
| Change In Fair Value Of Outstanding And Unvested Option Awards And Stock Awards Granted In Prior Fiscal Years [Member] | Non-PEO NEO [Member] | |||||||||||||||||||||||||||||||||||||||||||||||||||||||||||||||||||||||||||||||||||||||||||||||||||||||||||||||||||||||||||||||||||||||||||||||||||||||||||||||||||||||||||||||||||||||||||||||||||||||||||||||||||||||||||||||||||||||||||||||||||||||||||||||||||||||||||||||||||||||||||||||||||||||||||||||||||||||||||||||||||||||||||||||||||||||||||||||||||||||||||||||||||||||||||||
| Pay vs Performance Disclosure [Table] | |||||||||||||||||||||||||||||||||||||||||||||||||||||||||||||||||||||||||||||||||||||||||||||||||||||||||||||||||||||||||||||||||||||||||||||||||||||||||||||||||||||||||||||||||||||||||||||||||||||||||||||||||||||||||||||||||||||||||||||||||||||||||||||||||||||||||||||||||||||||||||||||||||||||||||||||||||||||||||||||||||||||||||||||||||||||||||||||||||||||||||||||||||||||||||||
| Adjustment to Compensation Amount | 149,112 | 90,401 | (2,269,110) | 6,303,872 | 3,066,178 | ||||||||||||||||||||||||||||||||||||||||||||||||||||||||||||||||||||||||||||||||||||||||||||||||||||||||||||||||||||||||||||||||||||||||||||||||||||||||||||||||||||||||||||||||||||||||||||||||||||||||||||||||||||||||||||||||||||||||||||||||||||||||||||||||||||||||||||||||||||||||||||||||||||||||||||||||||||||||||||||||||||||||||||||||||||||||||||||||||||||||||||||||||||||||
| Change In Fair Value As Of Vesting Date Of Option Awards And Stock Awards Grantedin Prior Fiscal Years For Which Applicable Vesting Conditions Were Satisfied During Fiscal Year [Member] | Non-PEO NEO [Member] | |||||||||||||||||||||||||||||||||||||||||||||||||||||||||||||||||||||||||||||||||||||||||||||||||||||||||||||||||||||||||||||||||||||||||||||||||||||||||||||||||||||||||||||||||||||||||||||||||||||||||||||||||||||||||||||||||||||||||||||||||||||||||||||||||||||||||||||||||||||||||||||||||||||||||||||||||||||||||||||||||||||||||||||||||||||||||||||||||||||||||||||||||||||||||||||
| Pay vs Performance Disclosure [Table] | |||||||||||||||||||||||||||||||||||||||||||||||||||||||||||||||||||||||||||||||||||||||||||||||||||||||||||||||||||||||||||||||||||||||||||||||||||||||||||||||||||||||||||||||||||||||||||||||||||||||||||||||||||||||||||||||||||||||||||||||||||||||||||||||||||||||||||||||||||||||||||||||||||||||||||||||||||||||||||||||||||||||||||||||||||||||||||||||||||||||||||||||||||||||||||||
| Adjustment to Compensation Amount | 439,849 | (511,224) | (2,469,621) | 3,050,194 | (51,351) | ||||||||||||||||||||||||||||||||||||||||||||||||||||||||||||||||||||||||||||||||||||||||||||||||||||||||||||||||||||||||||||||||||||||||||||||||||||||||||||||||||||||||||||||||||||||||||||||||||||||||||||||||||||||||||||||||||||||||||||||||||||||||||||||||||||||||||||||||||||||||||||||||||||||||||||||||||||||||||||||||||||||||||||||||||||||||||||||||||||||||||||||||||||||||
| Dividends Paid On Equity Awards [Member] | Non-PEO NEO [Member] | |||||||||||||||||||||||||||||||||||||||||||||||||||||||||||||||||||||||||||||||||||||||||||||||||||||||||||||||||||||||||||||||||||||||||||||||||||||||||||||||||||||||||||||||||||||||||||||||||||||||||||||||||||||||||||||||||||||||||||||||||||||||||||||||||||||||||||||||||||||||||||||||||||||||||||||||||||||||||||||||||||||||||||||||||||||||||||||||||||||||||||||||||||||||||||||
| Pay vs Performance Disclosure [Table] | |||||||||||||||||||||||||||||||||||||||||||||||||||||||||||||||||||||||||||||||||||||||||||||||||||||||||||||||||||||||||||||||||||||||||||||||||||||||||||||||||||||||||||||||||||||||||||||||||||||||||||||||||||||||||||||||||||||||||||||||||||||||||||||||||||||||||||||||||||||||||||||||||||||||||||||||||||||||||||||||||||||||||||||||||||||||||||||||||||||||||||||||||||||||||||||
| Adjustment to Compensation Amount | 80,773 | 71,002 | 81,123 | 112,099 | 71,652 | ||||||||||||||||||||||||||||||||||||||||||||||||||||||||||||||||||||||||||||||||||||||||||||||||||||||||||||||||||||||||||||||||||||||||||||||||||||||||||||||||||||||||||||||||||||||||||||||||||||||||||||||||||||||||||||||||||||||||||||||||||||||||||||||||||||||||||||||||||||||||||||||||||||||||||||||||||||||||||||||||||||||||||||||||||||||||||||||||||||||||||||||||||||||||
| Ford [Member] | |||||||||||||||||||||||||||||||||||||||||||||||||||||||||||||||||||||||||||||||||||||||||||||||||||||||||||||||||||||||||||||||||||||||||||||||||||||||||||||||||||||||||||||||||||||||||||||||||||||||||||||||||||||||||||||||||||||||||||||||||||||||||||||||||||||||||||||||||||||||||||||||||||||||||||||||||||||||||||||||||||||||||||||||||||||||||||||||||||||||||||||||||||||||||||||
| Pay vs Performance Disclosure [Table] | |||||||||||||||||||||||||||||||||||||||||||||||||||||||||||||||||||||||||||||||||||||||||||||||||||||||||||||||||||||||||||||||||||||||||||||||||||||||||||||||||||||||||||||||||||||||||||||||||||||||||||||||||||||||||||||||||||||||||||||||||||||||||||||||||||||||||||||||||||||||||||||||||||||||||||||||||||||||||||||||||||||||||||||||||||||||||||||||||||||||||||||||||||||||||||||
| PEO Total Compensation Amount | 22,777,075 | 23,268,171 | 21,722,152 | 24,914,886 | 20,450,586 | ||||||||||||||||||||||||||||||||||||||||||||||||||||||||||||||||||||||||||||||||||||||||||||||||||||||||||||||||||||||||||||||||||||||||||||||||||||||||||||||||||||||||||||||||||||||||||||||||||||||||||||||||||||||||||||||||||||||||||||||||||||||||||||||||||||||||||||||||||||||||||||||||||||||||||||||||||||||||||||||||||||||||||||||||||||||||||||||||||||||||||||||||||||||||
| PEO Actually Paid Compensation Amount | 24,767,687 | 20,487,194 | 8,014,859 | 43,342,034 | 29,075,377 | ||||||||||||||||||||||||||||||||||||||||||||||||||||||||||||||||||||||||||||||||||||||||||||||||||||||||||||||||||||||||||||||||||||||||||||||||||||||||||||||||||||||||||||||||||||||||||||||||||||||||||||||||||||||||||||||||||||||||||||||||||||||||||||||||||||||||||||||||||||||||||||||||||||||||||||||||||||||||||||||||||||||||||||||||||||||||||||||||||||||||||||||||||||||||
| Ford [Member] | Change In Accumulated Benefits Under Defined Benefit And Actuarial Pension Plans [Member] | PEO [Member] | |||||||||||||||||||||||||||||||||||||||||||||||||||||||||||||||||||||||||||||||||||||||||||||||||||||||||||||||||||||||||||||||||||||||||||||||||||||||||||||||||||||||||||||||||||||||||||||||||||||||||||||||||||||||||||||||||||||||||||||||||||||||||||||||||||||||||||||||||||||||||||||||||||||||||||||||||||||||||||||||||||||||||||||||||||||||||||||||||||||||||||||||||||||||||||||
| Pay vs Performance Disclosure [Table] | |||||||||||||||||||||||||||||||||||||||||||||||||||||||||||||||||||||||||||||||||||||||||||||||||||||||||||||||||||||||||||||||||||||||||||||||||||||||||||||||||||||||||||||||||||||||||||||||||||||||||||||||||||||||||||||||||||||||||||||||||||||||||||||||||||||||||||||||||||||||||||||||||||||||||||||||||||||||||||||||||||||||||||||||||||||||||||||||||||||||||||||||||||||||||||||
| Adjustment to Compensation Amount | (185,753) | (2,894,207) | 0 | (2,429,795) | (3,901,036) | ||||||||||||||||||||||||||||||||||||||||||||||||||||||||||||||||||||||||||||||||||||||||||||||||||||||||||||||||||||||||||||||||||||||||||||||||||||||||||||||||||||||||||||||||||||||||||||||||||||||||||||||||||||||||||||||||||||||||||||||||||||||||||||||||||||||||||||||||||||||||||||||||||||||||||||||||||||||||||||||||||||||||||||||||||||||||||||||||||||||||||||||||||||||||
| Ford [Member] | Service Costs Under Defined Benefit And Actuarial Pension Plans [Member] | PEO [Member] | |||||||||||||||||||||||||||||||||||||||||||||||||||||||||||||||||||||||||||||||||||||||||||||||||||||||||||||||||||||||||||||||||||||||||||||||||||||||||||||||||||||||||||||||||||||||||||||||||||||||||||||||||||||||||||||||||||||||||||||||||||||||||||||||||||||||||||||||||||||||||||||||||||||||||||||||||||||||||||||||||||||||||||||||||||||||||||||||||||||||||||||||||||||||||||||
| Pay vs Performance Disclosure [Table] | |||||||||||||||||||||||||||||||||||||||||||||||||||||||||||||||||||||||||||||||||||||||||||||||||||||||||||||||||||||||||||||||||||||||||||||||||||||||||||||||||||||||||||||||||||||||||||||||||||||||||||||||||||||||||||||||||||||||||||||||||||||||||||||||||||||||||||||||||||||||||||||||||||||||||||||||||||||||||||||||||||||||||||||||||||||||||||||||||||||||||||||||||||||||||||||
| Adjustment to Compensation Amount | 400,203 | 369,300 | 551,654 | 482,954 | 261,019 | ||||||||||||||||||||||||||||||||||||||||||||||||||||||||||||||||||||||||||||||||||||||||||||||||||||||||||||||||||||||||||||||||||||||||||||||||||||||||||||||||||||||||||||||||||||||||||||||||||||||||||||||||||||||||||||||||||||||||||||||||||||||||||||||||||||||||||||||||||||||||||||||||||||||||||||||||||||||||||||||||||||||||||||||||||||||||||||||||||||||||||||||||||||||||
| Ford [Member] | Grant Date Fair Value Of Option Awards And Stock Awards Granted In Fiscal Year [Member] | PEO [Member] | |||||||||||||||||||||||||||||||||||||||||||||||||||||||||||||||||||||||||||||||||||||||||||||||||||||||||||||||||||||||||||||||||||||||||||||||||||||||||||||||||||||||||||||||||||||||||||||||||||||||||||||||||||||||||||||||||||||||||||||||||||||||||||||||||||||||||||||||||||||||||||||||||||||||||||||||||||||||||||||||||||||||||||||||||||||||||||||||||||||||||||||||||||||||||||||
| Pay vs Performance Disclosure [Table] | |||||||||||||||||||||||||||||||||||||||||||||||||||||||||||||||||||||||||||||||||||||||||||||||||||||||||||||||||||||||||||||||||||||||||||||||||||||||||||||||||||||||||||||||||||||||||||||||||||||||||||||||||||||||||||||||||||||||||||||||||||||||||||||||||||||||||||||||||||||||||||||||||||||||||||||||||||||||||||||||||||||||||||||||||||||||||||||||||||||||||||||||||||||||||||||
| Adjustment to Compensation Amount | (16,454,034) | (14,874,249) | (17,399,594) | (17,379,272) | (11,248,988) | ||||||||||||||||||||||||||||||||||||||||||||||||||||||||||||||||||||||||||||||||||||||||||||||||||||||||||||||||||||||||||||||||||||||||||||||||||||||||||||||||||||||||||||||||||||||||||||||||||||||||||||||||||||||||||||||||||||||||||||||||||||||||||||||||||||||||||||||||||||||||||||||||||||||||||||||||||||||||||||||||||||||||||||||||||||||||||||||||||||||||||||||||||||||||
| Ford [Member] | Fair Value At Fiscal Year Endof Outstanding And Unvested Option Awards And Stock Awards Granted In Fiscal Year [Member] | PEO [Member] | |||||||||||||||||||||||||||||||||||||||||||||||||||||||||||||||||||||||||||||||||||||||||||||||||||||||||||||||||||||||||||||||||||||||||||||||||||||||||||||||||||||||||||||||||||||||||||||||||||||||||||||||||||||||||||||||||||||||||||||||||||||||||||||||||||||||||||||||||||||||||||||||||||||||||||||||||||||||||||||||||||||||||||||||||||||||||||||||||||||||||||||||||||||||||||||
| Pay vs Performance Disclosure [Table] | |||||||||||||||||||||||||||||||||||||||||||||||||||||||||||||||||||||||||||||||||||||||||||||||||||||||||||||||||||||||||||||||||||||||||||||||||||||||||||||||||||||||||||||||||||||||||||||||||||||||||||||||||||||||||||||||||||||||||||||||||||||||||||||||||||||||||||||||||||||||||||||||||||||||||||||||||||||||||||||||||||||||||||||||||||||||||||||||||||||||||||||||||||||||||||||
| Adjustment to Compensation Amount | 15,483,191 | 15,931,161 | 16,976,728 | 22,729,219 | 18,590,594 | ||||||||||||||||||||||||||||||||||||||||||||||||||||||||||||||||||||||||||||||||||||||||||||||||||||||||||||||||||||||||||||||||||||||||||||||||||||||||||||||||||||||||||||||||||||||||||||||||||||||||||||||||||||||||||||||||||||||||||||||||||||||||||||||||||||||||||||||||||||||||||||||||||||||||||||||||||||||||||||||||||||||||||||||||||||||||||||||||||||||||||||||||||||||||
| Ford [Member] | Change In Fair Value Of Outstanding And Unvested Option Awards And Stock Awards Granted In Prior Fiscal Years [Member] | PEO [Member] | |||||||||||||||||||||||||||||||||||||||||||||||||||||||||||||||||||||||||||||||||||||||||||||||||||||||||||||||||||||||||||||||||||||||||||||||||||||||||||||||||||||||||||||||||||||||||||||||||||||||||||||||||||||||||||||||||||||||||||||||||||||||||||||||||||||||||||||||||||||||||||||||||||||||||||||||||||||||||||||||||||||||||||||||||||||||||||||||||||||||||||||||||||||||||||||
| Pay vs Performance Disclosure [Table] | |||||||||||||||||||||||||||||||||||||||||||||||||||||||||||||||||||||||||||||||||||||||||||||||||||||||||||||||||||||||||||||||||||||||||||||||||||||||||||||||||||||||||||||||||||||||||||||||||||||||||||||||||||||||||||||||||||||||||||||||||||||||||||||||||||||||||||||||||||||||||||||||||||||||||||||||||||||||||||||||||||||||||||||||||||||||||||||||||||||||||||||||||||||||||||||
| Adjustment to Compensation Amount | 601,245 | 365,421 | (7,581,367) | 10,936,340 | 4,960,074 | ||||||||||||||||||||||||||||||||||||||||||||||||||||||||||||||||||||||||||||||||||||||||||||||||||||||||||||||||||||||||||||||||||||||||||||||||||||||||||||||||||||||||||||||||||||||||||||||||||||||||||||||||||||||||||||||||||||||||||||||||||||||||||||||||||||||||||||||||||||||||||||||||||||||||||||||||||||||||||||||||||||||||||||||||||||||||||||||||||||||||||||||||||||||||
| Ford [Member] | Change In Fair Value As Of Vesting Date Of Option Awards And Stock Awards Grantedin Prior Fiscal Years For Which Applicable Vesting Conditions Were Satisfied During Fiscal Year [Member] | PEO [Member] | |||||||||||||||||||||||||||||||||||||||||||||||||||||||||||||||||||||||||||||||||||||||||||||||||||||||||||||||||||||||||||||||||||||||||||||||||||||||||||||||||||||||||||||||||||||||||||||||||||||||||||||||||||||||||||||||||||||||||||||||||||||||||||||||||||||||||||||||||||||||||||||||||||||||||||||||||||||||||||||||||||||||||||||||||||||||||||||||||||||||||||||||||||||||||||||
| Pay vs Performance Disclosure [Table] | |||||||||||||||||||||||||||||||||||||||||||||||||||||||||||||||||||||||||||||||||||||||||||||||||||||||||||||||||||||||||||||||||||||||||||||||||||||||||||||||||||||||||||||||||||||||||||||||||||||||||||||||||||||||||||||||||||||||||||||||||||||||||||||||||||||||||||||||||||||||||||||||||||||||||||||||||||||||||||||||||||||||||||||||||||||||||||||||||||||||||||||||||||||||||||||
| Adjustment to Compensation Amount | 1,833,529 | (1,969,172) | (6,515,228) | 3,865,474 | (185,168) | ||||||||||||||||||||||||||||||||||||||||||||||||||||||||||||||||||||||||||||||||||||||||||||||||||||||||||||||||||||||||||||||||||||||||||||||||||||||||||||||||||||||||||||||||||||||||||||||||||||||||||||||||||||||||||||||||||||||||||||||||||||||||||||||||||||||||||||||||||||||||||||||||||||||||||||||||||||||||||||||||||||||||||||||||||||||||||||||||||||||||||||||||||||||||
| Ford [Member] | Dividends Paid On Equity Awards [Member] | PEO [Member] | |||||||||||||||||||||||||||||||||||||||||||||||||||||||||||||||||||||||||||||||||||||||||||||||||||||||||||||||||||||||||||||||||||||||||||||||||||||||||||||||||||||||||||||||||||||||||||||||||||||||||||||||||||||||||||||||||||||||||||||||||||||||||||||||||||||||||||||||||||||||||||||||||||||||||||||||||||||||||||||||||||||||||||||||||||||||||||||||||||||||||||||||||||||||||||||
| Pay vs Performance Disclosure [Table] | |||||||||||||||||||||||||||||||||||||||||||||||||||||||||||||||||||||||||||||||||||||||||||||||||||||||||||||||||||||||||||||||||||||||||||||||||||||||||||||||||||||||||||||||||||||||||||||||||||||||||||||||||||||||||||||||||||||||||||||||||||||||||||||||||||||||||||||||||||||||||||||||||||||||||||||||||||||||||||||||||||||||||||||||||||||||||||||||||||||||||||||||||||||||||||||
| Adjustment to Compensation Amount | 312,231 | 290,769 | 260,514 | 222,228 | 148,296 | ||||||||||||||||||||||||||||||||||||||||||||||||||||||||||||||||||||||||||||||||||||||||||||||||||||||||||||||||||||||||||||||||||||||||||||||||||||||||||||||||||||||||||||||||||||||||||||||||||||||||||||||||||||||||||||||||||||||||||||||||||||||||||||||||||||||||||||||||||||||||||||||||||||||||||||||||||||||||||||||||||||||||||||||||||||||||||||||||||||||||||||||||||||||||
| White [Member] | |||||||||||||||||||||||||||||||||||||||||||||||||||||||||||||||||||||||||||||||||||||||||||||||||||||||||||||||||||||||||||||||||||||||||||||||||||||||||||||||||||||||||||||||||||||||||||||||||||||||||||||||||||||||||||||||||||||||||||||||||||||||||||||||||||||||||||||||||||||||||||||||||||||||||||||||||||||||||||||||||||||||||||||||||||||||||||||||||||||||||||||||||||||||||||||
| Pay vs Performance Disclosure [Table] | |||||||||||||||||||||||||||||||||||||||||||||||||||||||||||||||||||||||||||||||||||||||||||||||||||||||||||||||||||||||||||||||||||||||||||||||||||||||||||||||||||||||||||||||||||||||||||||||||||||||||||||||||||||||||||||||||||||||||||||||||||||||||||||||||||||||||||||||||||||||||||||||||||||||||||||||||||||||||||||||||||||||||||||||||||||||||||||||||||||||||||||||||||||||||||||
| PEO Total Compensation Amount | 0 | 0 | 0 | 0 | 19,828,384 | ||||||||||||||||||||||||||||||||||||||||||||||||||||||||||||||||||||||||||||||||||||||||||||||||||||||||||||||||||||||||||||||||||||||||||||||||||||||||||||||||||||||||||||||||||||||||||||||||||||||||||||||||||||||||||||||||||||||||||||||||||||||||||||||||||||||||||||||||||||||||||||||||||||||||||||||||||||||||||||||||||||||||||||||||||||||||||||||||||||||||||||||||||||||||
| PEO Actually Paid Compensation Amount | $ 0 | $ 0 | $ 0 | $ 0 | 38,385,988 | ||||||||||||||||||||||||||||||||||||||||||||||||||||||||||||||||||||||||||||||||||||||||||||||||||||||||||||||||||||||||||||||||||||||||||||||||||||||||||||||||||||||||||||||||||||||||||||||||||||||||||||||||||||||||||||||||||||||||||||||||||||||||||||||||||||||||||||||||||||||||||||||||||||||||||||||||||||||||||||||||||||||||||||||||||||||||||||||||||||||||||||||||||||||||
| White [Member] | Change In Accumulated Benefits Under Defined Benefit And Actuarial Pension Plans [Member] | PEO [Member] | |||||||||||||||||||||||||||||||||||||||||||||||||||||||||||||||||||||||||||||||||||||||||||||||||||||||||||||||||||||||||||||||||||||||||||||||||||||||||||||||||||||||||||||||||||||||||||||||||||||||||||||||||||||||||||||||||||||||||||||||||||||||||||||||||||||||||||||||||||||||||||||||||||||||||||||||||||||||||||||||||||||||||||||||||||||||||||||||||||||||||||||||||||||||||||||
| Pay vs Performance Disclosure [Table] | |||||||||||||||||||||||||||||||||||||||||||||||||||||||||||||||||||||||||||||||||||||||||||||||||||||||||||||||||||||||||||||||||||||||||||||||||||||||||||||||||||||||||||||||||||||||||||||||||||||||||||||||||||||||||||||||||||||||||||||||||||||||||||||||||||||||||||||||||||||||||||||||||||||||||||||||||||||||||||||||||||||||||||||||||||||||||||||||||||||||||||||||||||||||||||||
| Adjustment to Compensation Amount | (1,028,610) | ||||||||||||||||||||||||||||||||||||||||||||||||||||||||||||||||||||||||||||||||||||||||||||||||||||||||||||||||||||||||||||||||||||||||||||||||||||||||||||||||||||||||||||||||||||||||||||||||||||||||||||||||||||||||||||||||||||||||||||||||||||||||||||||||||||||||||||||||||||||||||||||||||||||||||||||||||||||||||||||||||||||||||||||||||||||||||||||||||||||||||||||||||||||||||||
| White [Member] | Service Costs Under Defined Benefit And Actuarial Pension Plans [Member] | PEO [Member] | |||||||||||||||||||||||||||||||||||||||||||||||||||||||||||||||||||||||||||||||||||||||||||||||||||||||||||||||||||||||||||||||||||||||||||||||||||||||||||||||||||||||||||||||||||||||||||||||||||||||||||||||||||||||||||||||||||||||||||||||||||||||||||||||||||||||||||||||||||||||||||||||||||||||||||||||||||||||||||||||||||||||||||||||||||||||||||||||||||||||||||||||||||||||||||||
| Pay vs Performance Disclosure [Table] | |||||||||||||||||||||||||||||||||||||||||||||||||||||||||||||||||||||||||||||||||||||||||||||||||||||||||||||||||||||||||||||||||||||||||||||||||||||||||||||||||||||||||||||||||||||||||||||||||||||||||||||||||||||||||||||||||||||||||||||||||||||||||||||||||||||||||||||||||||||||||||||||||||||||||||||||||||||||||||||||||||||||||||||||||||||||||||||||||||||||||||||||||||||||||||||
| Adjustment to Compensation Amount | 0 | ||||||||||||||||||||||||||||||||||||||||||||||||||||||||||||||||||||||||||||||||||||||||||||||||||||||||||||||||||||||||||||||||||||||||||||||||||||||||||||||||||||||||||||||||||||||||||||||||||||||||||||||||||||||||||||||||||||||||||||||||||||||||||||||||||||||||||||||||||||||||||||||||||||||||||||||||||||||||||||||||||||||||||||||||||||||||||||||||||||||||||||||||||||||||||||
| White [Member] | Grant Date Fair Value Of Option Awards And Stock Awards Granted In Fiscal Year [Member] | PEO [Member] | |||||||||||||||||||||||||||||||||||||||||||||||||||||||||||||||||||||||||||||||||||||||||||||||||||||||||||||||||||||||||||||||||||||||||||||||||||||||||||||||||||||||||||||||||||||||||||||||||||||||||||||||||||||||||||||||||||||||||||||||||||||||||||||||||||||||||||||||||||||||||||||||||||||||||||||||||||||||||||||||||||||||||||||||||||||||||||||||||||||||||||||||||||||||||||||
| Pay vs Performance Disclosure [Table] | |||||||||||||||||||||||||||||||||||||||||||||||||||||||||||||||||||||||||||||||||||||||||||||||||||||||||||||||||||||||||||||||||||||||||||||||||||||||||||||||||||||||||||||||||||||||||||||||||||||||||||||||||||||||||||||||||||||||||||||||||||||||||||||||||||||||||||||||||||||||||||||||||||||||||||||||||||||||||||||||||||||||||||||||||||||||||||||||||||||||||||||||||||||||||||||
| Adjustment to Compensation Amount | (11,998,931) | ||||||||||||||||||||||||||||||||||||||||||||||||||||||||||||||||||||||||||||||||||||||||||||||||||||||||||||||||||||||||||||||||||||||||||||||||||||||||||||||||||||||||||||||||||||||||||||||||||||||||||||||||||||||||||||||||||||||||||||||||||||||||||||||||||||||||||||||||||||||||||||||||||||||||||||||||||||||||||||||||||||||||||||||||||||||||||||||||||||||||||||||||||||||||||||
| White [Member] | Fair Value At Fiscal Year Endof Outstanding And Unvested Option Awards And Stock Awards Granted In Fiscal Year [Member] | PEO [Member] | |||||||||||||||||||||||||||||||||||||||||||||||||||||||||||||||||||||||||||||||||||||||||||||||||||||||||||||||||||||||||||||||||||||||||||||||||||||||||||||||||||||||||||||||||||||||||||||||||||||||||||||||||||||||||||||||||||||||||||||||||||||||||||||||||||||||||||||||||||||||||||||||||||||||||||||||||||||||||||||||||||||||||||||||||||||||||||||||||||||||||||||||||||||||||||||
| Pay vs Performance Disclosure [Table] | |||||||||||||||||||||||||||||||||||||||||||||||||||||||||||||||||||||||||||||||||||||||||||||||||||||||||||||||||||||||||||||||||||||||||||||||||||||||||||||||||||||||||||||||||||||||||||||||||||||||||||||||||||||||||||||||||||||||||||||||||||||||||||||||||||||||||||||||||||||||||||||||||||||||||||||||||||||||||||||||||||||||||||||||||||||||||||||||||||||||||||||||||||||||||||||
| Adjustment to Compensation Amount | 19,829,982 | ||||||||||||||||||||||||||||||||||||||||||||||||||||||||||||||||||||||||||||||||||||||||||||||||||||||||||||||||||||||||||||||||||||||||||||||||||||||||||||||||||||||||||||||||||||||||||||||||||||||||||||||||||||||||||||||||||||||||||||||||||||||||||||||||||||||||||||||||||||||||||||||||||||||||||||||||||||||||||||||||||||||||||||||||||||||||||||||||||||||||||||||||||||||||||||
| White [Member] | Change In Fair Value Of Outstanding And Unvested Option Awards And Stock Awards Granted In Prior Fiscal Years [Member] | PEO [Member] | |||||||||||||||||||||||||||||||||||||||||||||||||||||||||||||||||||||||||||||||||||||||||||||||||||||||||||||||||||||||||||||||||||||||||||||||||||||||||||||||||||||||||||||||||||||||||||||||||||||||||||||||||||||||||||||||||||||||||||||||||||||||||||||||||||||||||||||||||||||||||||||||||||||||||||||||||||||||||||||||||||||||||||||||||||||||||||||||||||||||||||||||||||||||||||||
| Pay vs Performance Disclosure [Table] | |||||||||||||||||||||||||||||||||||||||||||||||||||||||||||||||||||||||||||||||||||||||||||||||||||||||||||||||||||||||||||||||||||||||||||||||||||||||||||||||||||||||||||||||||||||||||||||||||||||||||||||||||||||||||||||||||||||||||||||||||||||||||||||||||||||||||||||||||||||||||||||||||||||||||||||||||||||||||||||||||||||||||||||||||||||||||||||||||||||||||||||||||||||||||||||
| Adjustment to Compensation Amount | 11,882,907 | ||||||||||||||||||||||||||||||||||||||||||||||||||||||||||||||||||||||||||||||||||||||||||||||||||||||||||||||||||||||||||||||||||||||||||||||||||||||||||||||||||||||||||||||||||||||||||||||||||||||||||||||||||||||||||||||||||||||||||||||||||||||||||||||||||||||||||||||||||||||||||||||||||||||||||||||||||||||||||||||||||||||||||||||||||||||||||||||||||||||||||||||||||||||||||||
| White [Member] | Change In Fair Value As Of Vesting Date Of Option Awards And Stock Awards Grantedin Prior Fiscal Years For Which Applicable Vesting Conditions Were Satisfied During Fiscal Year [Member] | PEO [Member] | |||||||||||||||||||||||||||||||||||||||||||||||||||||||||||||||||||||||||||||||||||||||||||||||||||||||||||||||||||||||||||||||||||||||||||||||||||||||||||||||||||||||||||||||||||||||||||||||||||||||||||||||||||||||||||||||||||||||||||||||||||||||||||||||||||||||||||||||||||||||||||||||||||||||||||||||||||||||||||||||||||||||||||||||||||||||||||||||||||||||||||||||||||||||||||||
| Pay vs Performance Disclosure [Table] | |||||||||||||||||||||||||||||||||||||||||||||||||||||||||||||||||||||||||||||||||||||||||||||||||||||||||||||||||||||||||||||||||||||||||||||||||||||||||||||||||||||||||||||||||||||||||||||||||||||||||||||||||||||||||||||||||||||||||||||||||||||||||||||||||||||||||||||||||||||||||||||||||||||||||||||||||||||||||||||||||||||||||||||||||||||||||||||||||||||||||||||||||||||||||||||
| Adjustment to Compensation Amount | (395,379) | ||||||||||||||||||||||||||||||||||||||||||||||||||||||||||||||||||||||||||||||||||||||||||||||||||||||||||||||||||||||||||||||||||||||||||||||||||||||||||||||||||||||||||||||||||||||||||||||||||||||||||||||||||||||||||||||||||||||||||||||||||||||||||||||||||||||||||||||||||||||||||||||||||||||||||||||||||||||||||||||||||||||||||||||||||||||||||||||||||||||||||||||||||||||||||||
| White [Member] | Dividends Paid On Equity Awards [Member] | PEO [Member] | |||||||||||||||||||||||||||||||||||||||||||||||||||||||||||||||||||||||||||||||||||||||||||||||||||||||||||||||||||||||||||||||||||||||||||||||||||||||||||||||||||||||||||||||||||||||||||||||||||||||||||||||||||||||||||||||||||||||||||||||||||||||||||||||||||||||||||||||||||||||||||||||||||||||||||||||||||||||||||||||||||||||||||||||||||||||||||||||||||||||||||||||||||||||||||||
| Pay vs Performance Disclosure [Table] | |||||||||||||||||||||||||||||||||||||||||||||||||||||||||||||||||||||||||||||||||||||||||||||||||||||||||||||||||||||||||||||||||||||||||||||||||||||||||||||||||||||||||||||||||||||||||||||||||||||||||||||||||||||||||||||||||||||||||||||||||||||||||||||||||||||||||||||||||||||||||||||||||||||||||||||||||||||||||||||||||||||||||||||||||||||||||||||||||||||||||||||||||||||||||||||
| Adjustment to Compensation Amount | $ 267,635 | ||||||||||||||||||||||||||||||||||||||||||||||||||||||||||||||||||||||||||||||||||||||||||||||||||||||||||||||||||||||||||||||||||||||||||||||||||||||||||||||||||||||||||||||||||||||||||||||||||||||||||||||||||||||||||||||||||||||||||||||||||||||||||||||||||||||||||||||||||||||||||||||||||||||||||||||||||||||||||||||||||||||||||||||||||||||||||||||||||||||||||||||||||||||||||||
Insider Trading Policies and Procedures |
12 Months Ended |
|---|---|
Dec. 31, 2024 | |
| Insider Trading Policies and Procedures [Line Items] | |
| Insider Trading Policies and Procedures Adopted | true |
1 Year Abbott Laboratories Chart |
1 Month Abbott Laboratories Chart |

It looks like you are not logged in. Click the button below to log in and keep track of your recent history.
Support: +44 (0) 203 8794 460 | support@advfn.com
By accessing the services available at ADVFN you are agreeing to be bound by ADVFN's Terms & Conditions

 Hot Features