ADVFN ADVFN

We could not find any results for:
Make sure your spelling is correct or try broadening your search.

Trending Now

Toplists

It looks like you aren't logged in.
Click the button below to log in and view your recent history.

Hot Features

Registration Strip Icon for charts Register for streaming realtime charts, analysis tools, and prices.

Bitcoin (BTCUSD) Builds Strength Above Key Structure for Further Growth

Share On Facebook
share on Linkedin
Print

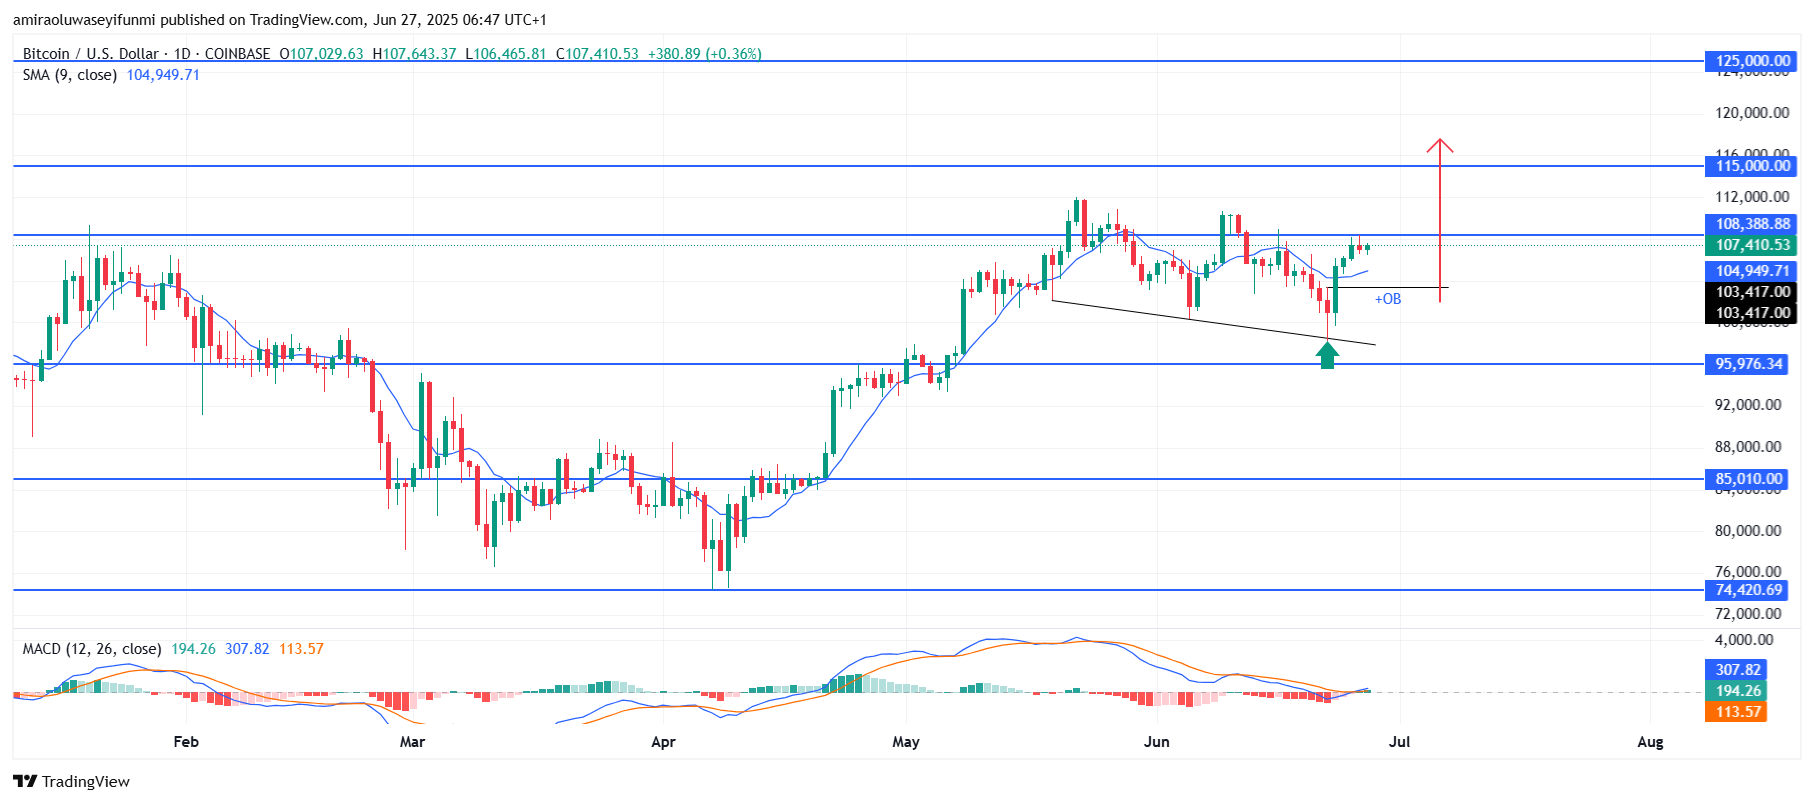
BTCUSD builds strength above key structure for further growth. Technically, the market broke out of a falling wedge pattern with strong bullish conviction leaving an order block at $103,420 level. The bullish engulfing pattern that followed this key test confirms renewed demand, pushing price action above the $106,000–$107,000 zone. Price has also reclaimed the resistance around $108,390, flipping it into a fresh support area. This structural shift is critical as it marks a transition from a previous range-bound phase to a trending environment.

Given the firm bullish setup, price is poised to advance further, with short- to mid-term projections targeting the $115,000 mark. A successful breach and daily close above $108,390 could trigger additional buying volume, propelling BTCUSD toward the $125,000 resistance in the longer term. However, a minor pullback toward $103,420 order block may occur before continuation, as it may provide bulls with fresh entries. Overall, bullish continuation remains the primary bias as long as the $103,400 order block holds.

COINBASE:BTCUSD Chart Image by amiraoluwaseyifunmiBTC Key Levels

Supply Levels: $108,390, 115,000, $125,000
Demand Levels: $95,980, $85,000, $74,420

What are the indicators saying?

The BTCUSD market is currently exhibiting a bullish momentum, supported by favorable alignment across technical indicators. The price has rebounded above the 9-day Simple Moving Average (SMA), currently at $104,950, serving as dynamic support for this upward trajectory. The MACD indicator confirms a bullish crossover with widening histogram bars and a rising MACD line above the signal line, indicating a surge in buying interest.

Learn from market wizards: Books to take your trading to the next level


CLICK HERE TO REGISTER FOR FREE ON ADVFN, the world's leading stocks and shares information website, provides the private investor with all the latest high-tech trading tools and includes live price data streaming, stock quotes and the option to access 'Level 2' data on all of the world's key exchanges (LSE, NYSE, NASDAQ, Euronext etc).

This area of the ADVFN.com site is for independent financial commentary. These blogs are provided by independent authors via a common carrier platform and do not represent the opinions of ADVFN Ltd. ADVFN Ltd does not monitor, approve, endorse or exert editorial control over these articles and does not therefore accept responsibility for or make any warranties in connection with or recommend that you or any third party rely on such information. The information available at ADVFN.com is for your general information and use and is not intended to address your particular requirements. In particular, the information does not constitute any form of advice or recommendation by ADVFN.COM and is not intended to be relied upon by users in making (or refraining from making) any investment decisions. Authors may or may not have positions in stocks that they are discussing but it should be considered very likely that their opinions are aligned with their trading and that they hold positions in companies, forex, commodities and other instruments they discuss.

Comments are closed

 
Do you want to write for our Newspaper? Get in touch: newspaper@advfn.com