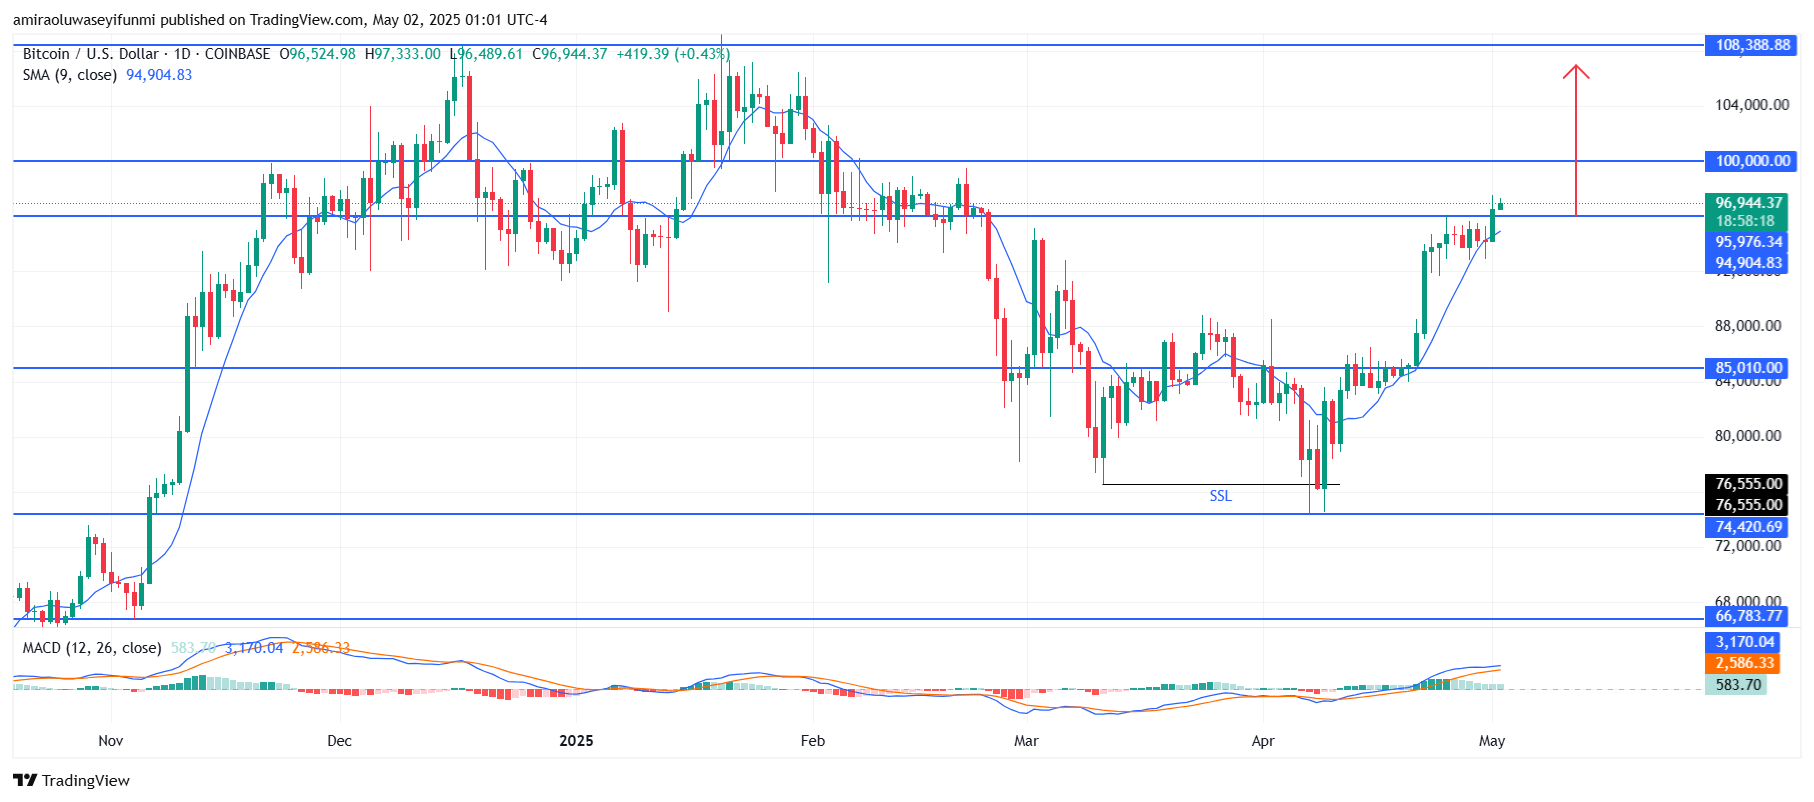
BTCUSD continues to be bullish with strong technical signals. From the price action on the daily chart, Bitcoin has recently broken above the significant resistance zone around $95,980 with strong bullish candles, turning the level into potential support. This breakout follows a well-formed base built near the $85,010 level, where BTCUSD found support and rallied with higher highs and higher lows—a hallmark of a bullish structure. Prior to that, the price had dipped toward the $74,420 zone but was rejected after the liquidity grab. The chart now reflects a continuation pattern as buyers have maintained pressure above the short-term moving average.
Given the current bullish breakout and positive indicator alignment, BTCUSD is projected to target the psychological resistance at $100,000 in the short term. If this level is breached with conviction, the next key resistance lies at $108,390, marking the previous high. On the downside, $94,910 now acts as the nearest support, followed by stronger structural support at $85,010. As long as the price stays above $94,910 and momentum indicators remain positive, Bitcoin is expected to continue its upward movement toward the $108,000 zone in the coming days or weeks.
BTC Key Levels
Supply Levels: $95,980, $100,000, $108,390
Demand Levels: $85,010, $74,420, $66,780
What are the indicators saying?
The BTCUSD pair shows a clear bullish trend, supported by strong technical indicators. The 9-day Simple Moving Average (SMA), currently at $94,910, is sloping upward and positioned below the current price, which is a classic confirmation of upward momentum.
The MACD (Moving Average Convergence Divergence) indicator has crossed above the signal line with a growing histogram in positive territory, signaling increasing bullish momentum. The MACD line itself stands at approximately 3,170, while the signal line is around 2,590, further reinforcing buyer dominance in the current market setup.
Learn from market wizards: Books to take your trading to the next level