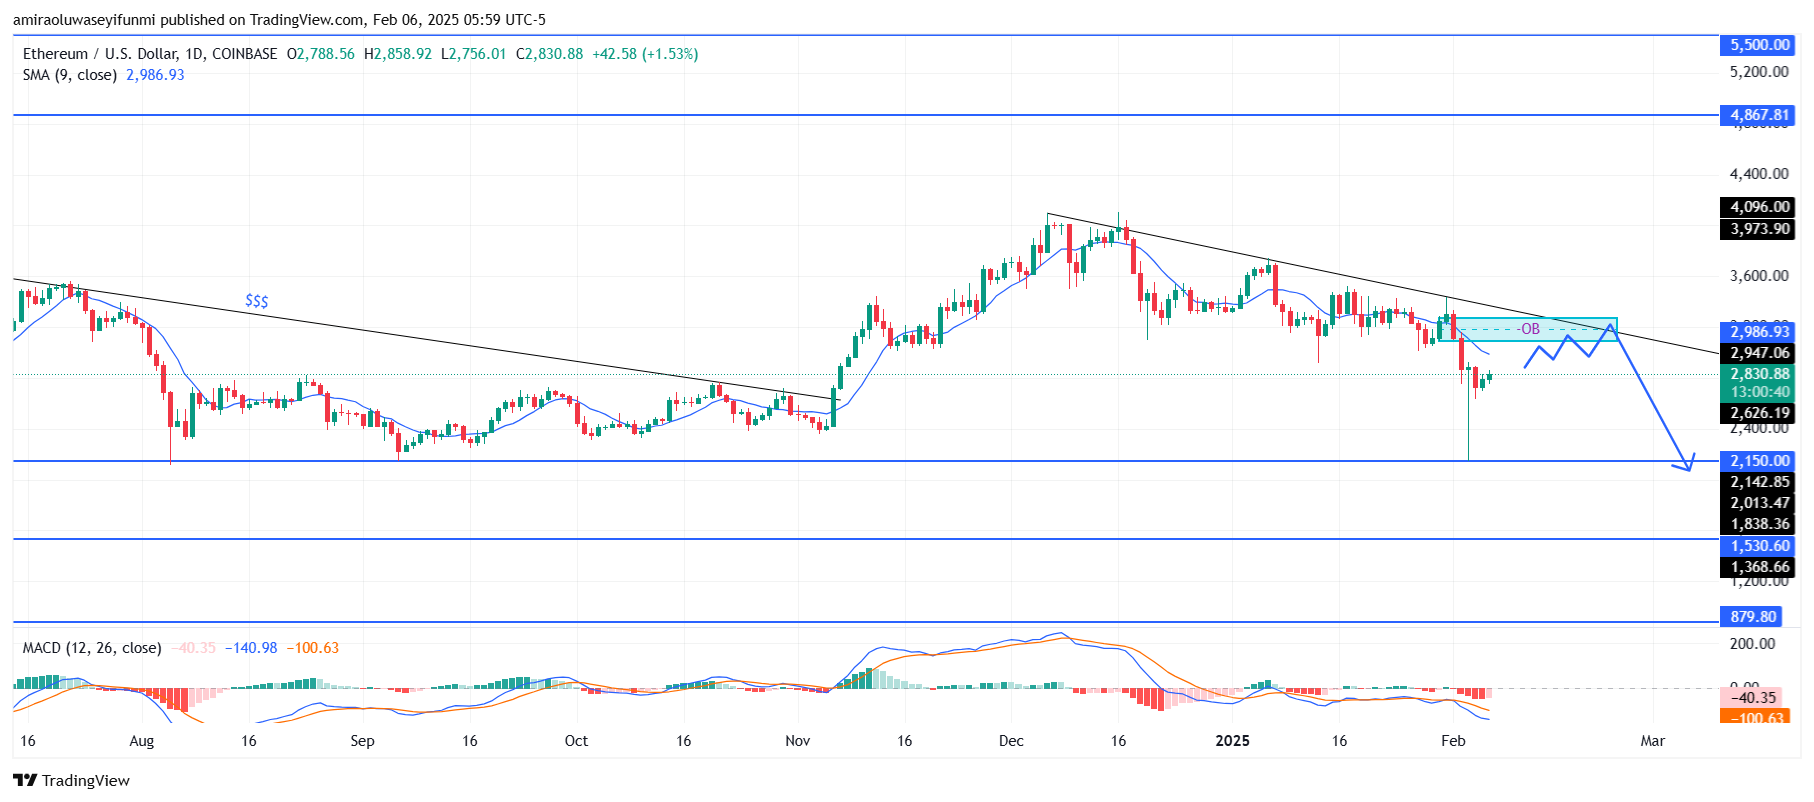
ETHUSD remains bearish as price struggles below the descending trendline. Price action indicates that ETHUSD is trapped below a descending trendline with more rejection coming from the order block (OB) around $2,980.

The market structure remains bearish, with lower highs and lower lows forming consistently. The recent attempt to push higher was met with resistance, reinforcing seller dominance. If ETHUSD fails to break above the trendline, further downside continuation is likely.
ETHUSD is expected to consolidate below $2,990 before a potential breakdown toward $2,150 support. If bearish momentum accelerates, deeper targets at $1,530 and $1,370 come into play. A breakdown below these levels could expose ETHUSD to $870 in extreme bearish conditions. However, an invalidation of the bearish order block would challenge the descending trendline and invalidate the immediate bearish setup.
ETH Key Levels
Demand Levels: $4000, $4870, $5500
Supply Levels: $2100, $1530, $880
What Are the Indicators Saying?
The ETHUSD daily chart shows bearish momentum, with the 9-day Simple Moving Average (SMA) at $2,990 acting as resistance. The Moving Average Convergence Divergence (MACD) indicator is in negative territory, with the MACD line at -40.36 and the signal line at -100.64, confirming downward pressure. The price remains below the SMA, signaling weakness, while volume trends suggest limited bullish participation. Unless ETHUSD reclaims the Moving Average, the bearish outlook remains dominant.
Learn from market wizards: Books to take your trading to the next level.Learn from market wizards: Books to take your trading to the next level.