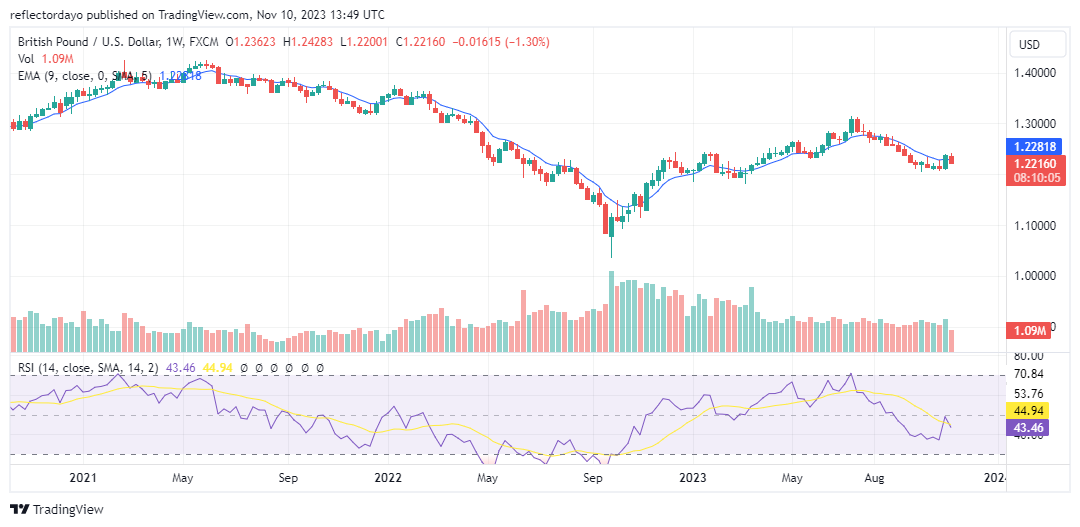
The 52-week high/low represents the highest and lowest stock prices in the past year. The 52-week high is the highest price reached, and the 52-week low is the lowest price attained during this period. Investors and traders use this measure to assess a stock’s performance over a year.

Determining the 52-Week High and Low Prices
Calculating the 52-week high/low involves tracking a stock’s highest and lowest prices in the past year. Investors can obtain this data from financial websites, stock market apps, and trading platforms. Alternatively, they can calculate it by monitoring daily closing prices and identifying the highest and lowest points over the last 52 weeks using tools like spreadsheets. Adjustments for stock splits or corporate actions, as well as considerations for dividends, may also be factored into the calculation.
Importance of 52-Week High and Low Prices
1. Performance Evaluation: Investors use the 52-week range to evaluate how well a stock has performed over a substantial period. Comparing the current price to its 52-week high and low provides insights into the stock’s volatility and potential trends.
2. Trend Identification: The 52-week high and low prices help identify trends in a stock’s price movement. If a stock is consistently reaching new highs, it may indicate positive momentum, while consistently approaching new lows could signal a negative trend.
3. Support and Resistance Levels: The 52-week range establishes levels of support and resistance. The 52-week low often serves as a support level, indicating a price point at which the stock has historically found buying interest. Conversely, the 52-week high may act as a resistance level where selling pressure could increase.
4. Investor Psychology: Traders and investors often react to the psychological significance of the 52-week range. A stock nearing its 52-week high might attract attention and buying interest, while approaching the 52-week low could be viewed as an opportunity or a signal of caution.
5. Decision-Making Tool: The 52-week high and low prices can influence investment decisions. Investors may use these levels to set entry or exit points, implement stop-loss orders, or gauge the risk and potential return of a particular investment.
Advantages and Drawbacks of Utilizing the 52-Week High/Low as an Indicator
1. Long-Term Performance Assessment: The 52-week high and low provide a comprehensive view of a stock’s performance over an extended period, aiding in evaluating its long-term stability and trends.
2. Trend Identification: These indicators help identify prevailing trends in the market. A stock consistently reaching new highs or lows can signal the strength or weakness of its current trend.
3. Support and Resistance Levels: The 52-week range establishes clear support and resistance levels, assisting traders in making informed decisions about entry and exit points.
4. Psychological Impact: The psychological significance of these levels can influence investor behavior. Near the 52-week low, stocks may be perceived as potential bargains, while nearing the 52-week high may attract buying interest.
5. Decision-Making Tool: Investors use the 52-week high and low to inform their decisions, such as setting stop-loss orders, identifying potential opportunities, or assessing risk-return profiles.
Disadvantages of Using 52-Week High/Low as an Indicator:
1. Lack of Context: Relying solely on the 52-week range may provide an incomplete picture. External factors, market conditions, or recent events can significantly impact a stock’s performance.
2. Volatility Considerations: Stocks with high volatility may frequently reach new highs and lows, making it challenging to discern meaningful trends or identify stable support or resistance levels.
3. Market Manipulation: In some cases, market participants may intentionally manipulate stock prices to trigger new highs or lows, leading to false signals for investors relying solely on these indicators.
4. Short-Term Noise: For short-term traders, the 52-week high and low may not be as relevant, as these indicators primarily focus on more extended timeframes.
5. Limited Predictive Power: While the 52-week range provides historical data, it may have limited predictive power for future price movements. Market conditions and investor sentiment can change rapidly.
Employing the 52-Week High/Low for Stock Evaluation
1. Identifying Recent Highs and Lows: Investors can use the 52-week high or low to pinpoint stocks that have recently reached their highest or lowest points.
2. Buying Opportunities at 52-Week High: When a stock has recently reached its 52-week high, it may present a buying opportunity, signaling potential continued positive performance.
3. Selling or Avoiding at 52-Week Low: Conversely, if a stock has recently reached its 52-week low, investors may consider selling or avoiding it, anticipating potential continued underperformance.
4. Comparing Current Price to Historical Performance: Beyond recent highs and lows, investors can leverage the 52-week high or low to assess a stock’s current price relative to its historical performance.
5. Evaluation of Overvaluation or Undervaluation: For instance, if a stock is trading near its 52-week high, investors can evaluate whether it is overvalued or undervalued based on its historical pricing trends.
Conclusion
In conclusion, the 52-week high/low metric offers investors a valuable long-term perspective, aiding in trend identification and informed decision-making. While it has limitations, combining this metric with others enhances the understanding of a stock’s performance. Given the complexities of stock market investing, seeking guidance from a specialized financial advisor can provide the expertise needed to navigate the market confidently, make informed decisions, and establish a personalized investment plan aligned with your financial goals.
Learn from market wizards: Books to take your trading to the next level


