Hot Features

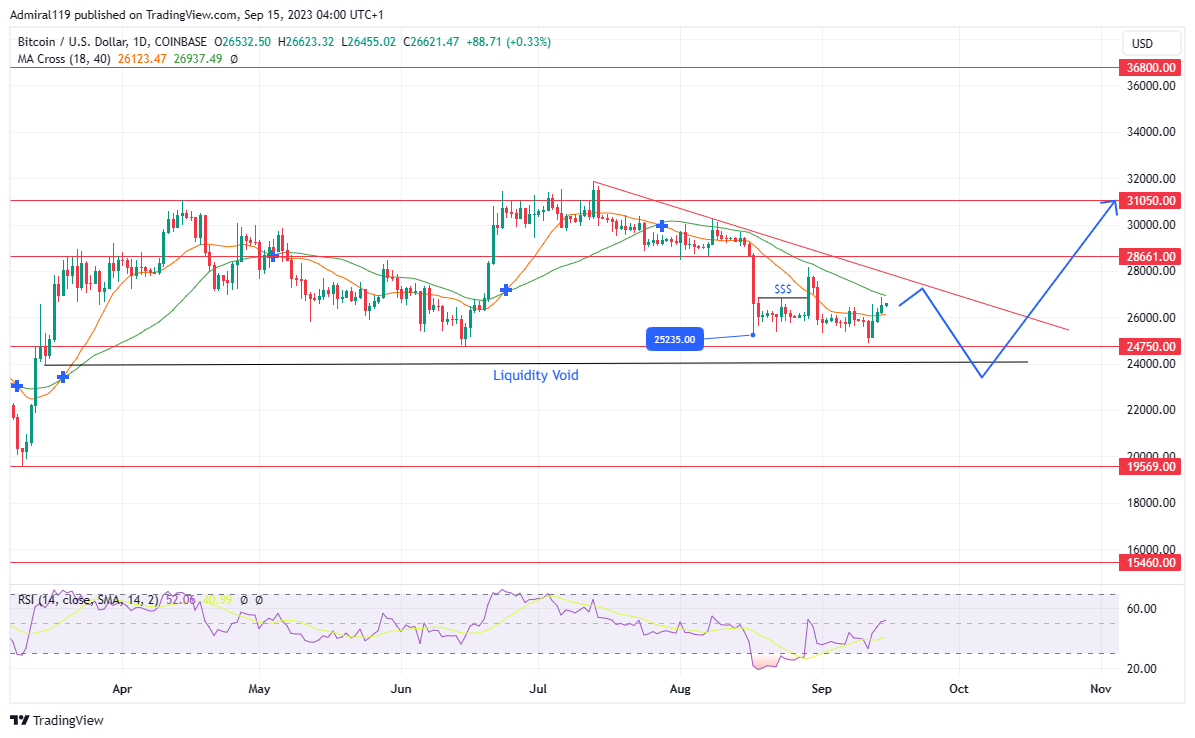
A reversal occurred as the price hit the $19569.00 support level in March 2023. This was followed by an aggressive rally that brought the price of Bitcoin beyond the previous resistance of $24750.00. Owing to the aggressive rally from the $19569.00 support, a liquidity void formed below the $24000.00 psychological level. BTCUSD further rallied higher, clearing previous highs until a new high formed at $31050.00.

Following a major retracement to the downside, BTCUSD declined in fractals until a push from $24750.00 led to another aggressive rally beyond $31050.00. The market swerved downward immediately after the $31050.00 high was invalidated. BTCUSD crashed alongside a falling trendline, which currently acts as the market’s resistance. The ongoing downtrend might continue into the liquidity void at the discount zone; however, a massive rally is likely to occur afterwards.
BTC Key Levels
Demand Levels: $24750.00, $19569.00, $15460.00
Supply Levels: $28661.00, $31050.00, $36800.00
What are the Indicators Saying:
As the market crashes alongside the diagonal resistance, the MA Cross also reveals that the market’s direction is bearish. As per the MA Cross, the market’s environment remains bearish as the bears still keep selling BTCUSD. According to the RSI (Relative Strength Index), the market just recovered from an oversold state. However, another crash might lead the market into an oversold state, which might eventually cause a massive surge to the upside.
Learn from market wizards: Books to take your trading to the next level