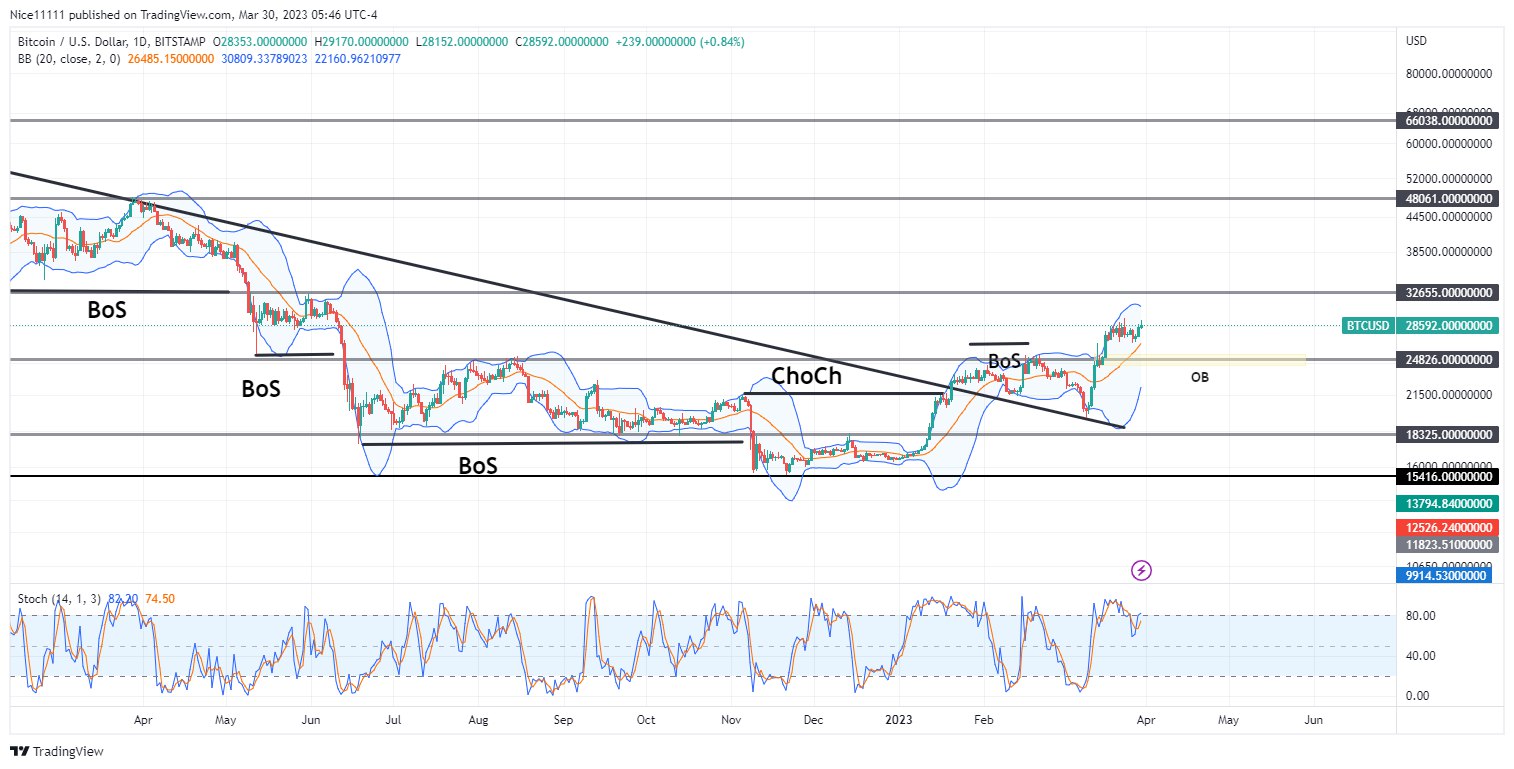
BTC turned bullish with the change of character (ChoCh) witnessed in January. The surge in the market broke the descending trendline that has resisted the Bulls. Immediately after the upthrust, the market retraced to test the previous resistance trendline, which has now turned into support. The buyers utilized the opportunity to fill long orders. The ascent continued with the recent Break of Structure (BOS) that launched the market above the 24826.0 support level. A bullish order block is resting at the 24826.0 support level. A pullback to the support level is anticipated to foster the continuation of the uptrend.

Bitcoin Key Levels
Resistance Levels: $32655.0, $48061.0, $66038.0
Support Levels: $24826.0, $18325.0, $15416.0
What Are the Indicators Saying?
In December, the Bollinger Bands pressed on the small-sized candles, which rested between the significant levels of 18325.0 and 15416.0. The consolidation phase came to an end as the new year opened. The price soared impulsively to rise above the midline of the Bollinger Bands. After facing resistance at 28426.0, the market retraced to find support. The daily candles pressed on the lower band of the Bollinger this month when the Stochastic indicated an oversold market. This energized the buyers to drive the price above $24826.0. The stochastic is currently overbought on the 24-hour chart. A retracement towards the Moving Average of the Bollinger bands is expected to provide support to continue the uptrend.
Learn from market wizards: Books to take your trading to the next level


