Bitcoin has maintained a flat market for about a month now. The price continued to move around the equilibrium region of the market despite the high volatility. The key resistance level was $17,000, and it feels like a solid hindrance for the bulls. But in the last session, the supply line finally gave way to bullish pressure.

Bitcoin Price Analysis: The Indicator’s Point of View
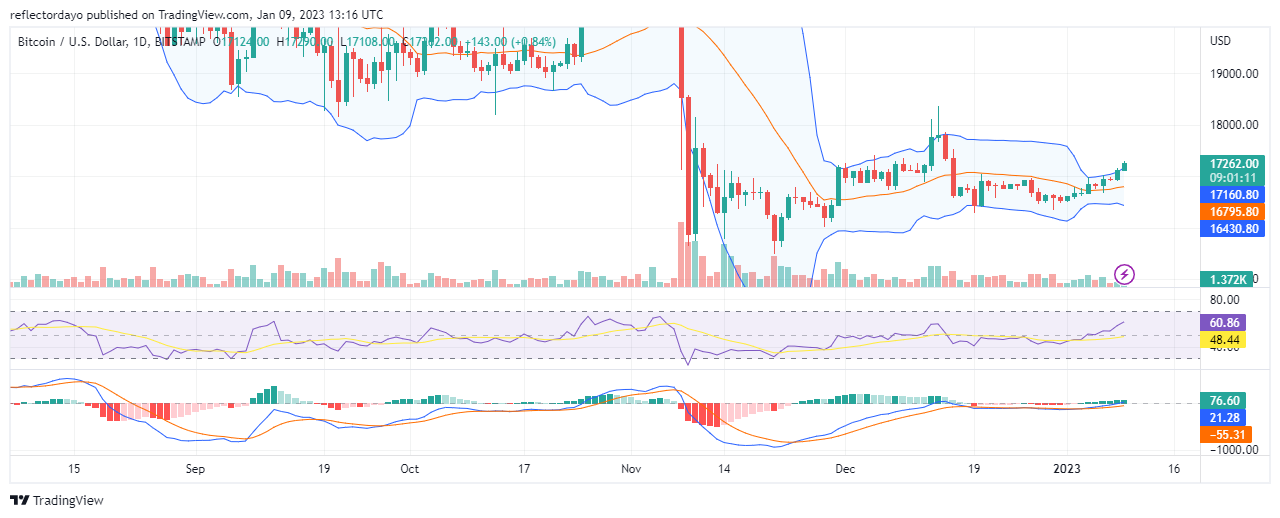
On January 4, the Bollinger Band Indicator began to contract, indicating that the market is about to move in a specific direction. Initially, the bears had a slight upper hand as the market was slightly below the 20-day moving average. Currently, the bulls have not only caught up with the bear market, but they are also gaining ground above $17,000. The upper band of the Bollinger Indicator is moving to the upside. But the lower band is not moving in agreement with the upper band and the 20-day moving average. This means that the bears are also formidable.
Bitcoin Price Analysis: 4-Hour Chart Outlook
From the 4-hour chart standpoint, we can see the bull market’s momentum wearing out as it approaches $17,258. As the struggle between demand and supply intensifies, it seems very likely that the bulls will secure a very strong support price level above $17,000 and then use it as the basis to capture more price levels. This is because when we look at the market since January 1, Bitcoin has been having higher lows. The market has been bullish. And the next stop for the market should be $17,600.
Learn from market wizards: Books to take your trading to the next level