ADVFN Logo ADVFN

We could not find any results for:
Make sure your spelling is correct or try broadening your search.

Trending Now

Toplists

It looks like you aren't logged in.
Click the button below to log in and view your recent history.

Hot Features

Registration Strip Icon for monitor Customisable watchlists with full streaming quotes from leading exchanges, such as LSE, NASDAQ, NYSE, AMEX, Bovespa, BIT and more.

Ethereum Struggles above $1,300 Support as It Risks a Decline

Share On Facebook
share on Linkedin
Print

Key Highlights
ETH/USD resumes consolidation
Ether holds above $1,300 support

©

Ethereum (ETH) Current Statistics
The current price: $1,312.89
Market Capitalization: $160,742,647,053
Trading Volume: $6,943,790,222
Key Resistance Zones: $2,500, $3,300, $4,000
Key Support Zones: $2,000, $1,500, $1,000

Ethereum (ETH) Price Analysis October 22, 2021
Ethereum (ETH) is in a sideways trend as the largest altcoin consolidates below the moving average lines. Ether’s price is struggling to break above the 21-day line SMA. The altcoin will turn down from the moving average lines, each time it retests the recent high. The price movement has been stagnant because of the presence of Doji candlesticks. Ether will trend when the 21-day line SMA is breached and the bullish momentum is sustained. Conversely, if Ether turns down from the moving average lines, the selling pressure will resume. The cryptocurrency will decline and revisit the $1,000 psychological price level.

Ethereum Struggles above $1,300 Support as It Risks a Decline

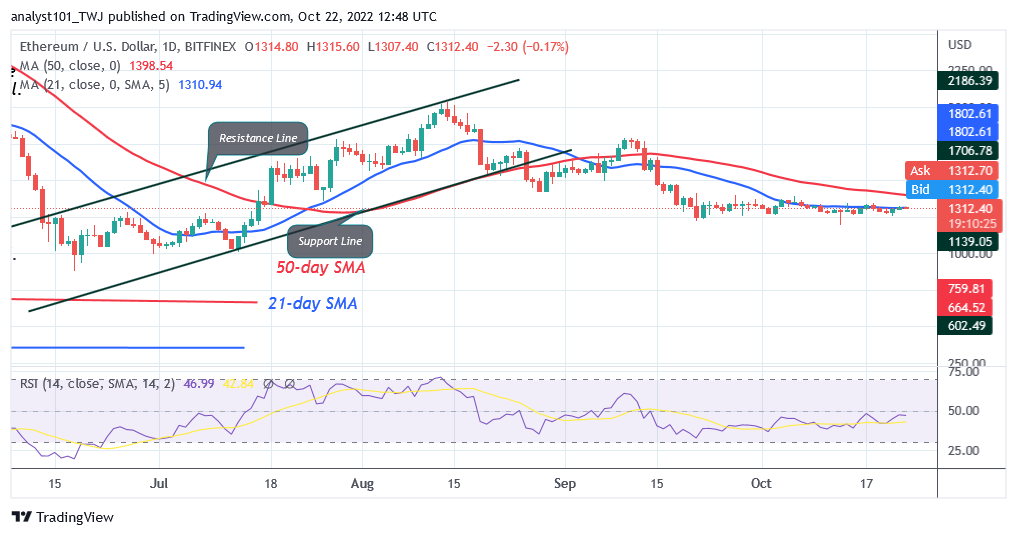
ETH/USD – Daily Chart

Ethereum Technical Indicators Reading
The biggest altcoin is in a sideways move at level 46 of the Relative Strength Index for period 14. The altcoin may decline if the price bars remain below the moving average lines. The moving average lines are sloping horizontally indicating a sideways trend. The cryptocurrency will resume selling pressure as it is above the 80% range of the daily stochastic. Ether is trading in the overbought region.

Conclusion
Ether is trading in the overbought region. According to the price indicator, the biggest altcoin will further decline. On October 20 downtrend, Ether made an upward correction and a candle body tested the 61.8% Fibonacci retracement level. The correction implies that ETH will fall to level 1.618 Fibonacci extension or $1,228.84.

Ethereum Struggles above $1,300 Support as It Risks a Decline

ETH/USD – 4 Hour Chart

Learn from market wizards: Books to take your trading to the next level

CLICK HERE TO REGISTER FOR FREE ON ADVFN, the world's leading stocks and shares information website, provides the private investor with all the latest high-tech trading tools and includes live price data streaming, stock quotes and the option to access 'Level 2' data on all of the world's key exchanges (LSE, NYSE, NASDAQ, Euronext etc).

This area of the ADVFN.com site is for independent financial commentary. These blogs are provided by independent authors via a common carrier platform and do not represent the opinions of ADVFN Plc. ADVFN Plc does not monitor, approve, endorse or exert editorial control over these articles and does not therefore accept responsibility for or make any warranties in connection with or recommend that you or any third party rely on such information. The information available at ADVFN.com is for your general information and use and is not intended to address your particular requirements. In particular, the information does not constitute any form of advice or recommendation by ADVFN.COM and is not intended to be relied upon by users in making (or refraining from making) any investment decisions. Authors may or may not have positions in stocks that they are discussing but it should be considered very likely that their opinions are aligned with their trading and that they hold positions in companies, forex, commodities and other instruments they discuss.

Leave A Reply

 
Do you want to write for our Newspaper? Get in touch: newspaper@advfn.com