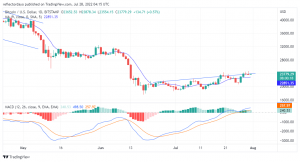
After some times of struggling at around $20,000 (even falling slightly below it), BTCUSD has made some impressive upward movements. Bullish market activities have taken the price to around $24,000. On the 28th of July, Bitcoin closed with a price at $23,954. The two days that followed was an intense struggle between buyers and sellers, but the price for those two days closed in favour of sellers. At this point, the battle seems fierce between the buyers and the sellers as the price action seems pegged at slightly below $24,000.

What the Indicators Are Saying
The Relative Strength Index is showing a strong upward trend for the market at 60%. The Moving Average Convergence and Divergence shows signals of an upward trend for the market. The 12 day EMA and the 26 Day EMA are performing farther away from each other. This is a signal that a reversal of trend is not likely to take place at this time. The histogram of the MACD supported the fact of an uptrend market.

Although the price have tested the $24,000 resistance several times, there is a possibilities that it will soon overcome the resistance and move on upward.
With the signals from the indicators, the price of the Bitcoin may soon reach up to around $25,000. However, if the price closes today in favour of the sellers, the market trend may reverse because the day’s bar will be ‘a shooting star candlestick. therefore, investors needs to wait to watch the trend that will follow before they take their decisions.
Teach yourself technical analysis: Technical Analysis

 Hot Features


