Solana consolidates above $100
SOL/USD is in a downtrend

Solana (SOL) Current Statistics
The current price: $101.36
Market Capitalization: $51,901,058,136
Trading Volume: $1,876,922,199
Major supply zones: $280, $300, $320
Major demand zones: $160, $140, $120
Solana (SOL) Price Analysis April 18, 2022
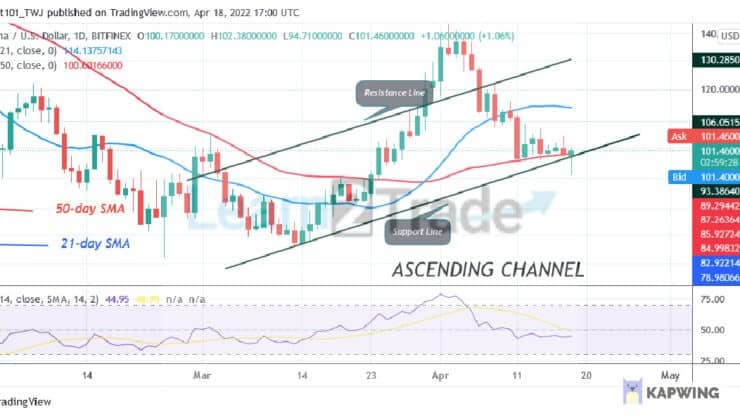
Solana’s (SOL) price is in a downtrend as the cryptocurrency recovers above $100. Solana is trading above the 50-day line SMA but below the 21-day line. Since April 11, the altcoin has been fluctuating between the moving averages. The bulls and bears are yet to break the moving average lines. A break below or above the moving average lines will compel the altcoin to trend. Today, the altcoin is trading above the 50-day line SMA if the bears break below the current support, the market will decline to the lows of $87 or $77 price levels. Conversely, if price rebounds above current support, the 50-day line SMA will be broken and Solana will rise to revisit the previous highs.

Solana (SOL) Technical Indicators Reading
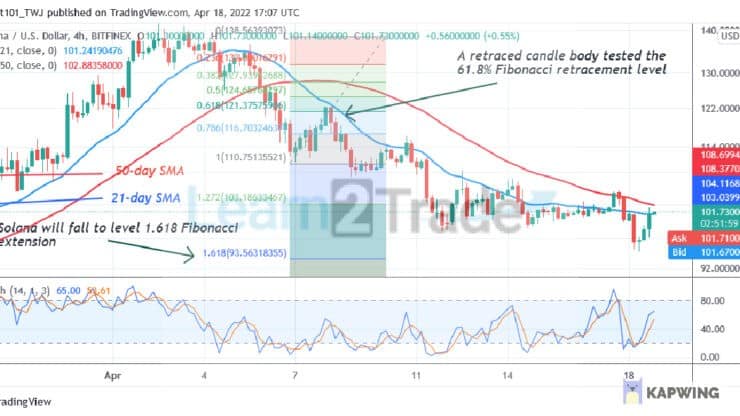
The altcoin is at level 45 of the Relative Strength Index for period 14. The market is in the downtrend zone and below the centerline 50. The crypto’s price is between the moving averages as the altcoin continues to be range-bound in a range. Solana is above the 70% range of the daily stochastic. The market is in a bullish momentum. The 21-day line and the 50-day line SMAs are sloping downward.
Conclusion
SOL/USD is in a downward move as it recovers above $100. The altcoin is making an upward correction as it faces rejection at the high of $103. Meanwhile, on April 7 downtrend; a retraced candle body tested the 61.8% Fibonacci retracement level. The retracement indicates that Solana will fall to level 1.618 Fibonacci extensions or $93.84.


 Hot Features


