Key Resistance Levels: $1,900, $1,950, $2000
Key Support Levels: $1,750, $1, 700,$1,650

Gold (XAUUSD) Long-term Trend: Bullish
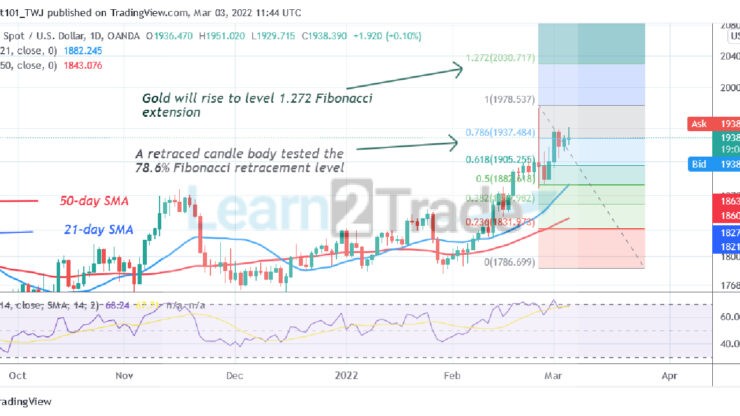
Gold (XAUUSD) is in an uptrend as it targets the $2,020 high. The bulls have also broken above the resistance at $1,870. The market has reached a high of $1,950. Presently, Gold is fluctuating below the recent high. On February 24 uptrend, a retraced candle body tested the 78.6% Fibonacci retracement level. The retracement indicates that Gold will rise but reverse at level 1.272 Fibonacci extension or $2,020.72.

Daily Chart Indicators Reading:
Gold is at level 69 of the Relative Strength Index for period 14. The gold price has reached the overbought region of the market. There is a long candlestick tail pointing towards the resistance zone. This indicates that the recent high has strong selling pressure. Therefore further upward movement of prices is doubtful. The 21-day SMA and the 50-day SMA are sloping upward indicating the uptrend.
Gold (XAUUSD) Medium-term bias: Bearish
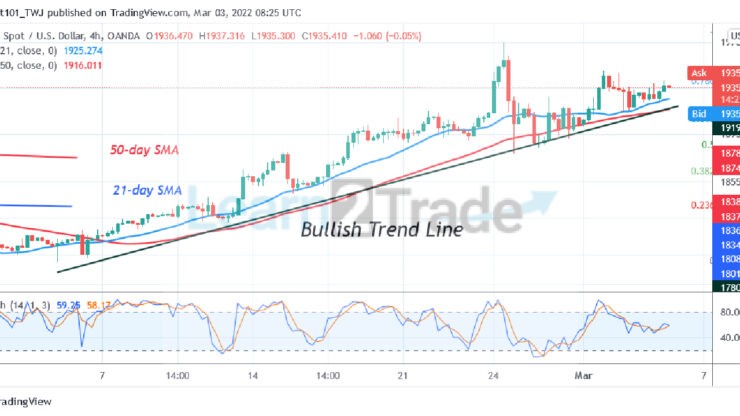
On the 4-hour chart, the Gold price is in an uptrend. On February 24, the Gold price rebounded to reach the high $1,950 but was repelled immediately. The price fell above the moving averages as the market continues its upward move.

4-hour Chart Indicators Reading
XAUUSD is above the 40% range of the daily stochastic. A bullish trend line is drawn showing the support levels of prices. The 21-day SMA and the 50-day SMA are sloping upward indicating the uptrend.
General Outlook for Gold (XAUUSD)
Gold’s (XAUUSD) price is in an uptrend as it it targets the $2,020 high. The market has reached the overbought region. Sellers will emerge in the overbought region push prices down.
Source: https://learn2.trade

 Hot Features


